
Canada (TSX) P/E ratio & earnings growth
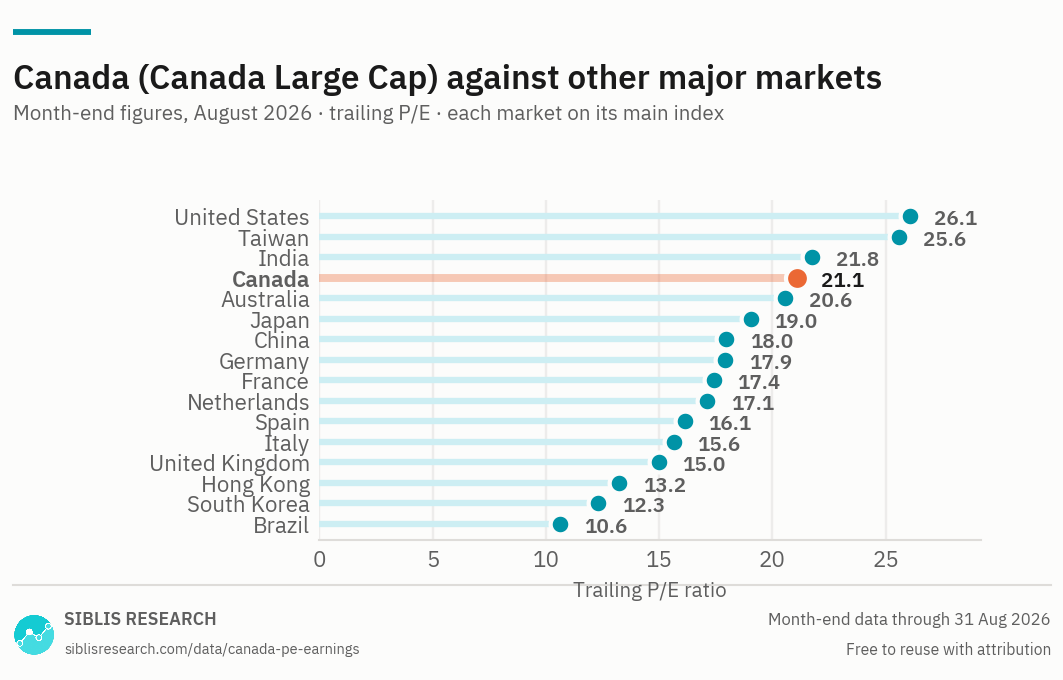
Trailing and forward price-to-earnings ratios, CAPE and earnings for Canada's equity market, calculated using large-cap companies listed on the Toronto Stock Exchange. For the same measures across every major market see P/E ratios by country.
| Measure | Sept 2026 | Sept 2025 | Chg |
|---|---|---|---|
| Trailing P/E ratio | 20.51 | 21.16 | -0.65 |
| Forward P/E ratio | 15.77 | 17.63 | -1.86 |
| CAPE ratio | 27.09 | 25.22 | +1.87 |
Trailing P/E is aggregate market capitalisation divided by aggregate normalised net income over the previous twelve months. Forward P/E uses consensus estimates for the next twelve months.

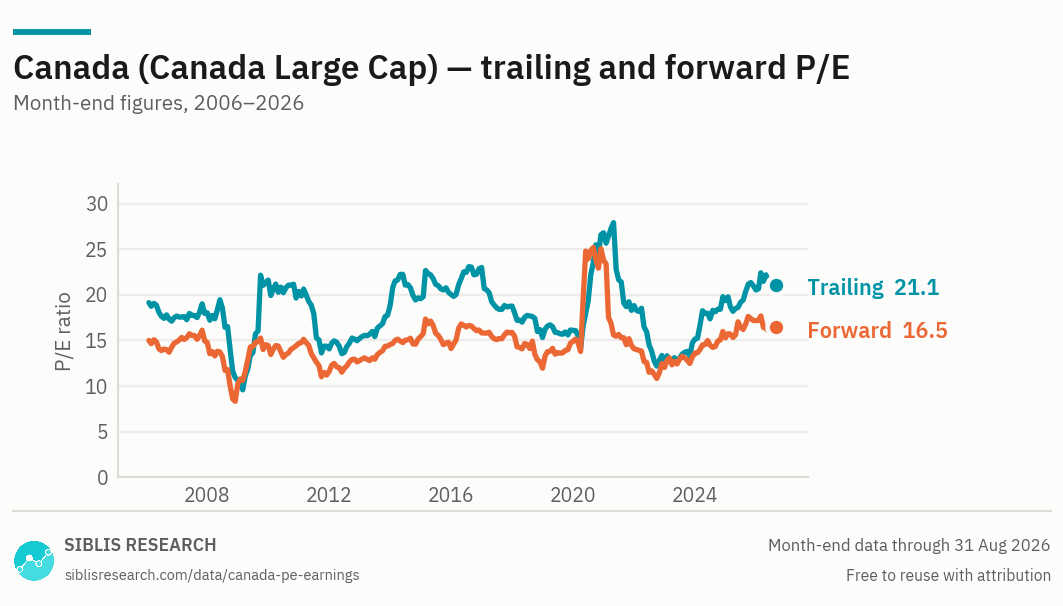
Four and a half decades of monthly data, covering the 1980s inflation, the 1990 recession, the dot-com period, 2008 and the commodity cycles either side of it.

| Month | Trailing P/E | Forward P/E | CAPE | EPS index |
|---|---|---|---|---|
| Sept 2026 | 20.51 | 15.77 | 27.09 | 258.5 |
| 2025 Dec | 20.53 | 17.17 | 26.20 | 232.5 |
| 2024 Dec | 19.36 | 15.28 | 21.84 | 192.2 |
| 2023 Dec | 15.15 | 13.61 | 19.50 | 208.2 |
| 2022 Dec | 12.53 | 12.03 | 19.53 | 232.8 |
| 2021 Dec | 18.82 | 14.08 | 23.66 | 169.7 |
| 2020 Dec | 26.80 | 23.80 | 20.33 | 97.9 |
| 2019 Dec | 16.11 | 14.91 | 20.35 | 159.3 |
| 2018 Dec | 15.32 | 11.95 | 17.88 | 140.7 |
| 2017 Dec | 18.76 | 15.88 | 20.53 | 130.0 |
| 2016 Dec | 23.00 | 15.82 | 19.55 | 100.0 |
Sept 2026 at a glance
Year on year
Where Canada stands, September 2026
Canada trades at 20.51 times trailing earnings, against 21.16 a year ago. Index earnings rose 21% over the year while the index itself rose 17%. The multiple barely moved, because earnings and price travelled together.
At 15.77 forward against a trailing 20.51, analysts are pricing a 30% rise in earnings over the coming twelve months. That is an expectation rather than a forecast with a track record, and the gap is worth reading as the size of what is being assumed.
A commodity index with a banking sector attached
Banks, energy and materials make up most of the Canadian stock market. That concentration is the single most useful thing to know before evaluating historical multiples of the Canadian market, because it makes the P/E ratio behave cyclically in a way it does not for a more diversified market.
Commodity earnings peak when commodity prices peak. The multiple is therefore at its lowest when those earnings are at their highest — which is usually the least attractive moment — and at its highest when earnings have collapsed. A low Canadian P/E is as often a signal about where the cycle sits as about what the market costs.
This is the standard trap in cyclical markets, and it is what CAPE is designed to avoid: averaging ten years of earnings takes the cycle out of the denominator.
Earnings and price over the past years
After a sharp decline during the COVID-19 market crash, corporate earnings in Canada rebounded swiftly, driven by strong commodity prices, and fiscal stimulus. This rapid recovery reflected the resilience of key sectors such as energy, financials, and materials.
However, by late 2023, earnings began to decline, impacted by higher interest rates, slowing economic growth, and weaker consumer demand. Rising borrowing costs and global uncertainties weighed on corporate profitability.
The downtrend continued into 2024, with earnings contracting even further. Persistent inflationary pressures, tighter monetary policy, and weaker global demand contributed to earnings deterioration, particularly in rate-sensitive sectors like real estate.
As of 2026, the earnings of Canadian companies have grown rapidly over the past twelve months. While earnings have been rising, so have the stock prices, which is why the multiple has not really moved that much.
Where this data is used
Some examples. Siblis valuation data appears in peer-reviewed journals, central bank publications and the financial press.
The whole database, every trading day
This page publishes one reading a month for 16 countries. The Global Equity Valuations Database is the whole thing.
How this is calculated
Aggregate market capitalisation of the index constituents divided by their aggregate earnings.
- Trailing P/E — Aggregate normalised net income over the previous twelve months. Major purely accounting gains and losses are removed.
- Forward P/E — Consensus estimates for the next twelve months, aggregated the same way.
- CAPE — Price divided by the average of ten years of inflation-adjusted aggregate earnings.
- Earnings — Shown indexed, to provide a common baseline. Index-level earnings per share in Canadian dollars are not comparable with other markets in level terms.
- Revisions — Figures are point-in-time. If a company later restates its results, the historic reading is left exactly as first published: the series reflects what was known at the time, not what is known now.
Cite this page
Siblis Research. (2026). Canada (TSX) P/E Ratio, CAPE & Earnings [Data set]. Retrieved 30 September 2026, from siblisresearch.com/data/canada-pe-earnings/
@misc{siblis_canada_pe_earnings,
  title={Canada (TSX) P/E Ratio, CAPE & Earnings}, author={{Siblis Research}},
  year={2026}, url={https://siblisresearch.com/data/canada-pe-earnings/},
  urldate={2026-09-30}}
Charts on this page may be reproduced free of charge with attribution to Siblis Research and a link to this page.