
Growth and value stocks — P/E, CAPE and earnings growth
Valuation ratios and earnings growth for the Russell 1000 Growth and Russell 1000 Value indices, shown next to U.S. large caps, small caps and the NASDAQ 100.
Growth trades at 33.53 times trailing earnings and value at 20.49 — a ratio of 1.64. The number people expect to find here is a growth premium at an extreme. It is not: the median since 2000 is 1.43 and the median over the past ten years is 1.70. The unusual reading on this page is on the value side.
| Valuation | Earnings growth | ||||||
|---|---|---|---|---|---|---|---|
| Index | Trailing P/E | Forward P/E | Implied | CAPE | 1 year | 3 yr p.a. | 5 yr p.a. |
| Russell 1000 Growth | 33.53 | 23.61 | +42.0% | 53.89 | +30.7% | +22.1% | +13.4% |
| U.S. Large Cap | 25.96 | 25.96 | 0.0% | 35.89 | +12.6% | +10.3% | +12.2% |
| NASDAQ 100 | 35.09 | 23.26 | +50.9% | 58.89 | +48.9% | +27.0% | +18.4% |
| Russell 2000 | 35.91 | 23.59 | +52.2% | 60.84 | +8.6% | +2.8% | +27.3% |
| Russell 1000 Value | 20.49 | 16.15 | +26.9% | 24.69 | +21.3% | +6.2% | +5.9% |
Implied is the earnings growth the market has already priced in: trailing P/E divided by forward P/E, minus one. Earnings growth is the compound annual change in aggregate index earnings, nominal, not adjusted for inflation. Growth and value are cuts of the same large and mid cap universe, so a company can sit in both indices at partial weight.

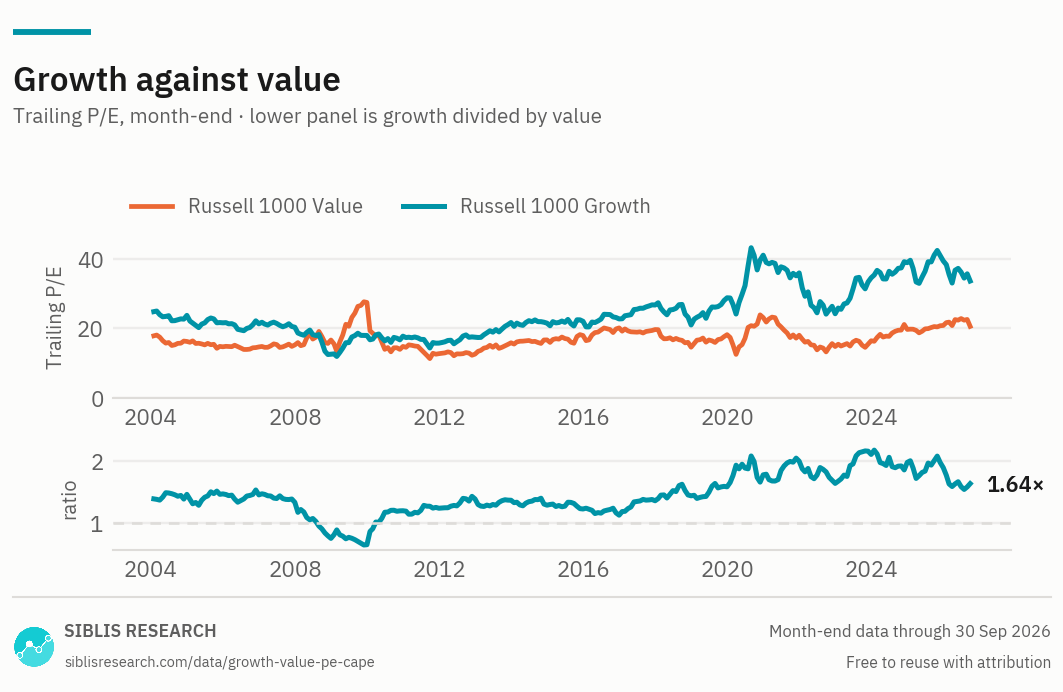
The lower panel is growth divided by value. It sits above one in all but nineteen months since 2000 — every one of them between August 2008 and February 2010, when value's own earnings collapsed and briefly inverted the relationship. So the question is rarely whether the ratio is above one but where in its own range it sits. Today's 1.64 against a ten-year median of 1.70.

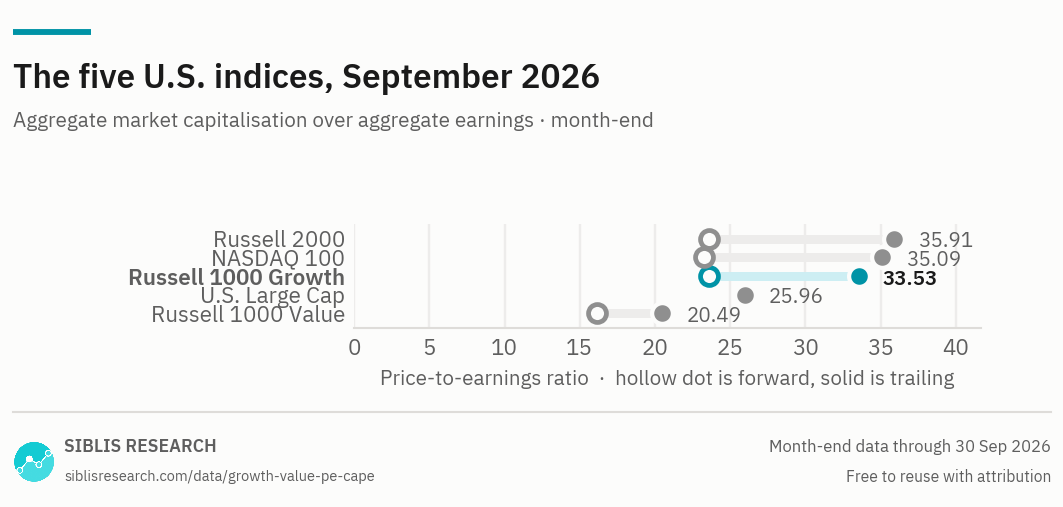
The hollow dot is the forward multiple and the solid dot the trailing one. Growth carries the wider gap, at +42.0% implied against value's +26.9% — analysts expect the faster-growing half of the market to keep growing faster.
| Month | U.S. Large Cap | NASDAQ 100 | Russell 2000 | Russell 1000 Growth | Russell 1000 Value |
|---|---|---|---|---|---|
| Sept 2026 | 25.96 | 35.09 | 35.91 | 33.53 | 20.49 |
| 2025 Dec | 25.38 | 32.32 | 35.52 | 39.32 | 20.76 |
| 2024 Dec | 24.61 | 32.36 | 33.44 | 38.82 | 19.62 |
| 2023 Dec | 21.79 | 30.25 | 26.72 | 34.46 | 16.36 |
| 2022 Dec | 18.55 | 23.72 | 51.74 | 24.13 | 14.71 |
| 2021 Dec | 26.14 | 38.00 | 67.53 | 35.86 | 17.95 |
| 2020 Dec | 31.05 | 39.72 | Negative | 40.95 | 23.03 |
| 2019 Dec | 21.78 | 26.47 | 55.27 | 28.71 | 18.11 |
| 2018 Dec | 16.77 | 20.75 | 39.41 | 20.90 | 14.51 |
| 2017 Dec | 21.84 | 25.84 | 114.93 | 26.64 | 19.58 |
| 2016 Dec | 20.59 | 23.08 | 49.57 | 22.64 | 20.06 |
The complete series is part of the Global Equity Valuations Database.
Russell 1000 Growth, Sept 2026
Earnings, annualised
Where growth and value stand, September 2026
Growth trades at 33.53 times trailing earnings with a CAPE of 53.89; value at 20.49 with a CAPE of 24.69. Aggregate growth earnings rose +22.1% a year over three years against +6.2% for value, and +13.4% a year over five against +5.9%.
That earnings gap is the whole basis of the valuation gap, and it is persistent rather than recent. A ratio of 1.64 between two indices whose earnings compound at +13.4% and +5.9% a year is not, on its face, an anomaly.
The reading that stands out is value's CAPE, not growth's
Value's CAPE of 24.69 is the highest reading in its series, which begins in 2004 — above where it stood at the 2007 peak, and above every month since. Its trailing multiple of 20.49 tells a similar story in a noisier way: only 37 months since 2000 have been higher, and most of those fell in 2009, 2020 and 2021, when the ratio was high because earnings had collapsed rather than because prices had risen.
This gets very little attention, because the attention goes to growth multiples. It deserves some: a value index is normally where investors look when the rest of the market is expensive, and the premise of that move is that the value index is cheap in absolute terms rather than merely cheaper than the alternative. That premise is weaker now than the ratio between the two suggests.
No equivalent statement is made about growth's CAPE, and deliberately so. The growth index's ten-year average earnings were destroyed by the dot-com bust and took the following decade to rebuild, which leaves its CAPE history carrying a stretch of readings that describe an earnings collapse rather than a valuation. Ranking today against that history would be arithmetic without meaning. The comparison this page does make — growth's multiple against value's, both computed the same way at the same moment — has no such problem, which is why the ratio is what the charts lead with.
Growth and value are definitions, and the definitions move
Neither index is a fixed set of companies. Constituents are assigned by valuation and growth characteristics and reassigned at each reconstitution, so a company that re-rates moves between them. A firm can also sit in both at partial weight when its characteristics are mixed.
Two consequences for reading the series. Composition changes over time in a way a country index does not — the sector mix of the growth index today is not what it was in 2004. And the indices are not independent: the same universe is being divided, so when one side's multiple rises the other side's constituent list changes as well.
For a cut of the U.S. market by listing venue rather than by style, the NASDAQ 100 page covers the largest concentration of growth companies. For a cut by size, the Russell 2000 page covers small caps, where the aggregate ratio behaves differently again.
The U.S. index pages
All three carry the same five indices. What changes is which one is the subject, and the problem with the multiple that that index happens to show most clearly.
| Page | The question it answers | Why that one |
|---|---|---|
| NASDAQ 100 | What does the largest concentration of U.S. growth companies cost? | The index with the fastest earnings growth of the five, and the shortest CAPE history — which is the trap on that page. |
| Russell 2000 | Why do small caps carry a higher multiple than large caps? | An aggregate ratio nets the losses of unprofitable constituents against everyone else. Small caps are where that matters most. |
| Growth and value this page | How wide is the gap between growth and value, against its own history? | The same companies split by style rather than by size or listing venue, so the comparison is like for like. |
Where this data is used
Some examples. Siblis valuation data appears in peer-reviewed journals, central bank publications and the financial press.
Growth and value, every trading day
This page publishes one reading a month. The Global Equity Valuations Database is the whole dataset.
How this is calculated
Aggregate market capitalisation of the index divided by the aggregate earnings of its constituent companies — not an average of the constituents' individual multiples.
- Trailing P/E — Aggregate normalised net income over the previous twelve months. Major purely accounting gains and losses are removed.
- Forward P/E — Consensus estimates for the next twelve months, aggregated the same way.
- CAPE — Price divided by the average of ten years of inflation-adjusted aggregate earnings. The growth series carries a distorted stretch in the years after 2000, when its ten-year average earnings had collapsed.
- Earnings growth — Compound annual change in aggregate index earnings, nominal. Shown as n/a where earnings at the start of the period were negative.
- Index construction — Growth and value are two cuts of the same large and mid cap universe, assigned by valuation and growth characteristics. A company may appear in both at partial weight.
- Revisions — Figures are point-in-time. If a company later restates its results, the historic reading is left exactly as first published: the series reflects what was known at the time, not what is known now.
Cite this page
Siblis Research. (2026). Growth vs Value Stocks P/E & CAPE [Data set]. Retrieved 30 September 2026, from siblisresearch.com/data/growth-value-pe-cape/
@misc{siblis_growth_value_pe_cape,
  title={Growth vs Value Stocks P/E & CAPE}, author={{Siblis Research}},
  year={2026}, url={https://siblisresearch.com/data/growth-value-pe-cape/},
  urldate={2026-09-30}}
Charts on this page may be reproduced free of charge with attribution to Siblis Research and a link to this page.