
Price to book ratios by U.S. sector
Price to book for the eleven United States sectors, month-end, with ten years of year-end history.
Price to book answers one question: what is the market paying for the assets on the balance sheet. It is the measure that keeps working where earnings-based ratios break down. For earnings-based comparisons use P/E and earnings or EV/EBITDA.
| Sector | Sept 2026 | Sept 2025 | Change |
|---|---|---|---|
| Information Technology | 13.99 | 14.21 | -0.22 |
| Consumer Discretionary | 7.16 | 9.40 | -2.24 |
| Industrials | 7.09 | 6.78 | +0.31 |
| Consumer Staples | 6.73 | 6.71 | +0.02 |
| Health Care | 5.57 | 4.74 | +0.83 |
| Communication Services | 4.97 | 5.67 | -0.70 |
| Real Estateseries begins 2001 | 3.07 | 3.16 | -0.09 |
| Materials | 3.02 | 2.89 | +0.13 |
| Energy | 2.49 | 2.05 | +0.44 |
| Financials | 2.32 | 2.50 | -0.18 |
| Utilities | 2.01 | 2.46 | -0.45 |
Aggregate market capitalisation divided by aggregate book value of equity. Sector price-to-book ratios are calculated for the United States only; there is no global or global ex-U.S. equivalent.

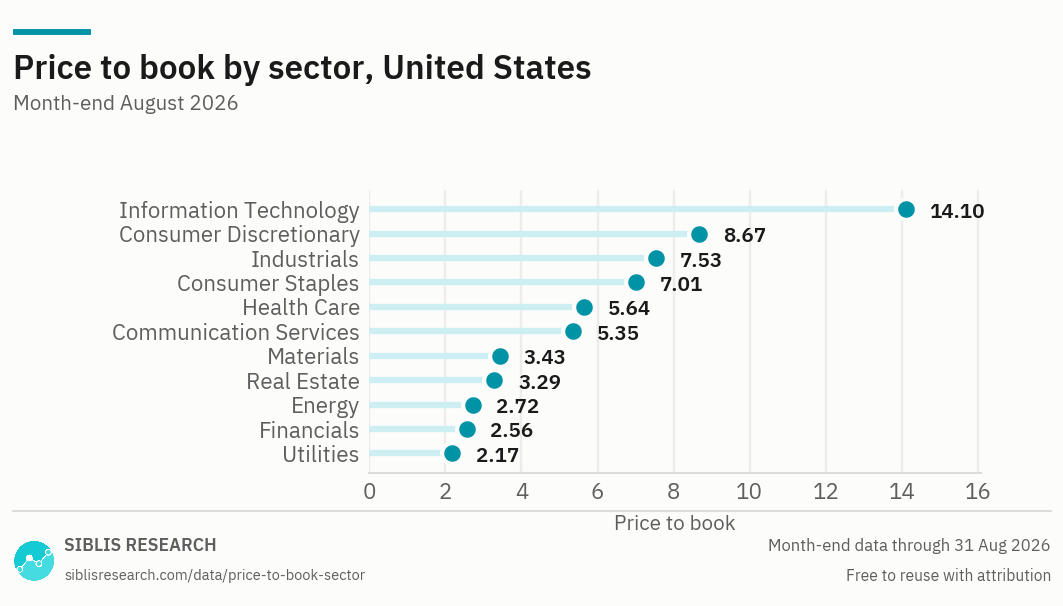
The ranking is driven as much by how much of a sector's value sits on its balance sheet as by how expensive it is. A software company's main assets are not recorded there; a utility's are.
| Month | Information Technology | Consumer Discretionary | Industrials | Consumer Staples | Health Care | Communication Services | Real Estate | Materials | Energy | Financials | Utilities |
|---|---|---|---|---|---|---|---|---|---|---|---|
| Sept 2026 | 13.99 | 7.16 | 7.09 | 6.73 | 5.57 | 4.97 | 3.07 | 3.02 | 2.49 | 2.32 | 2.01 |
| 2025 Dec | 13.40 | 9.22 | 6.72 | 6.55 | 5.21 | 5.93 | 3.03 | 2.90 | 1.93 | 2.48 | 2.35 |
| 2024 Dec | 13.09 | 10.06 | 6.35 | 6.33 | 4.86 | 5.10 | 3.02 | 2.74 | 1.99 | 2.33 | 2.22 |
| 2023 Dec | 11.42 | 9.40 | 5.82 | 5.54 | 4.83 | 3.91 | 3.03 | 3.01 | 2.13 | 2.05 | 1.93 |
| 2022 Dec | 7.93 | 7.54 | 5.27 | 6.12 | 5.07 | 2.61 | 3.00 | 2.90 | 2.50 | 1.64 | 2.21 |
| 2021 Dec | 12.25 | 12.19 | 5.77 | 6.62 | 5.52 | 4.52 | 4.76 | 3.48 | 1.90 | 1.70 | 2.41 |
| 2020 Dec | 10.73 | 12.15 | 5.35 | 6.16 | 4.78 | 4.03 | 3.46 | 3.14 | 1.28 | 1.40 | 2.19 |
| 2019 Dec | 7.76 | 7.99 | 5.26 | 5.78 | 4.43 | 3.46 | 3.77 | 2.70 | 1.65 | 1.51 | 2.25 |
| 2018 Dec | 5.95 | 6.64 | 4.41 | 4.62 | 4.23 | 3.06 | 3.06 | 2.48 | 1.56 | 1.32 | 1.94 |
| 2017 Dec | 5.66 | 6.29 | 4.84 | 5.24 | 3.97 | 3.77 | 3.28 | 2.95 | 1.98 | 1.54 | 1.98 |
| 2016 Dec | 4.40 | 5.24 | 4.53 | 4.88 | 3.49 | 3.60 | 3.14 | 3.81 | 2.12 | 1.37 | 1.88 |
Sept 2026, United States
Why the spread is so wide
In September 2026, Information Technology trades at 13.99 times book and Utilities at 2.01 — a 7.0-fold range. That is far wider than the spread on any earnings-based measure, and the reason is accounting rather than valuation.
Book value records what a company paid for its assets. It captures factories, property, inventory and financial assets well. It captures brands, software, research and customer relationships barely at all, because under current accounting most of that spending is expensed as it happens rather than capitalised. A sector whose value is mostly intangible will therefore show a high price-to-book ratio permanently, and a sector whose value is mostly physical will show a low one permanently.
What it is good for
Two uses survive that limitation.
The first is asset-heavy and financial businesses. Banks above all: a bank's balance sheet is its business, book value is a reasonably faithful record of what it owns, and its earnings can be volatile, negative, or distorted by provisioning in ways that make a P/E ratio useless. Unlike the EV/EBITDA figure, which covers only payments and exchange businesses, the Financials price-to-book ratio here is calculated on the whole sector, banks included.
The second is comparing a sector against its own history rather than against other sectors. The accounting distortion is roughly constant within a sector over time, so the level relative to that sector's own past is informative even when the cross-sector ranking is not. That is what the ten-year table above is for.
How far back this goes
The underlying series begins in 1979 for nine of the eleven sectors, and in 2001 for Real Estate, which was part of Financials until then. The table above publishes the ten most recent year-ends; the full monthly history back to 1979 is part of the subscription.
Choosing a measure
No single ratio answers every question about a sector. Each of these pages covers the same eleven sectors — what changes is the question the measure is good at, and how far the coverage reaches.
| Measure | The question it answers | Why that one |
|---|---|---|
| EV/EBITDA | How does one sector compare across markets? | Sits above tax and debt, so it survives crossing borders. The only measure here that makes an international sector comparison sound. |
| P/E and earnings | How fast are a sector’s earnings growing? | Trailing and forward multiples with the earnings behind them, so the multiple and its denominator can be read together. |
| CAPE | Is a sector expensive against its own history? | Averages a decade of real earnings, which smooths the cycle out of the denominator. |
| Price to book this page | What is the market paying for the assets? | Works where earnings-based measures break down — asset-heavy sectors, and banks in particular. U.S. sectors only. |
| Dividend yield | Which sectors pay, and how much? | Income rather than valuation, but it moves inversely with price and is read alongside the multiples. U.S. sectors only. |
Where this data is used
Some examples. Siblis valuation data appears in peer-reviewed journals, central bank publications and the financial press.
The whole database, every trading day
This page publishes ten year-ends and the current reading. The Global Equity Valuations Database carries the full history, and every other ratio alongside it.
How this is calculated
Aggregate market capitalisation of a sector's constituent companies divided by their aggregate book value of shareholders' equity — not an average of the constituents' individual ratios.
- Book value — Total shareholders' equity from the most recent reported balance sheet.
- Coverage — The eleven United States sectors. Financials covers the whole sector, banks and insurers included. This measure is not calculated for the global or global ex-U.S. sector indices, in the free data or in the subscription.
- Frequency — Month-end, monthly.
- Revisions — Figures are point-in-time. If a company later restates its results, the historic reading is left exactly as first published: the series reflects what was known at the time, not what is known now.
Cite this page
Siblis Research. (2026). Price-to-Book (P/B) Ratio by Sector [Data set]. Retrieved 30 September 2026, from siblisresearch.com/data/price-to-book-sector/
@misc{siblis_price_to_book_sector,
  title={Price-to-Book (P/B) Ratio by Sector}, author={{Siblis Research}},
  year={2026}, url={https://siblisresearch.com/data/price-to-book-sector/},
  urldate={2026-09-30}}
Charts on this page may be reproduced free of charge with attribution to Siblis Research and a link to this page.