
Dividend yields by U.S. sector
Trailing dividend yield for the eleven United States sectors, month-end, with ten years of year-end history.
Yield is an income measure, not a valuation measure. It tells you what a sector pays out, not what it is worth. For valuation, use EV/EBITDA, P/E and earnings or price to book.
| Sector | Sept 2026 | Sept 2025 | Change |
|---|---|---|---|
| Real Estate | 3.69% | 3.35% | +0.34 |
| Utilities | 3.17% | 2.75% | +0.42 |
| Energy | 2.50% | 3.45% | -0.95 |
| Consumer Staples | 2.49% | 2.52% | -0.03 |
| Financials | 1.67% | 1.41% | +0.26 |
| Materials | 1.62% | 1.86% | -0.24 |
| Health Care | 1.58% | 1.81% | -0.23 |
| Industrials | 1.27% | 1.36% | -0.09 |
| Communication Services | 0.68% | 0.67% | +0.01 |
| Consumer Discretionary | 0.68% | 0.63% | +0.05 |
| Information Technology | 0.51% | 0.50% | +0.01 |
Aggregate dividends paid over the previous twelve months divided by aggregate market capitalisation. Change is in percentage points. Sector dividend yields are calculated for the United States only; there is no global or global ex-U.S. equivalent.

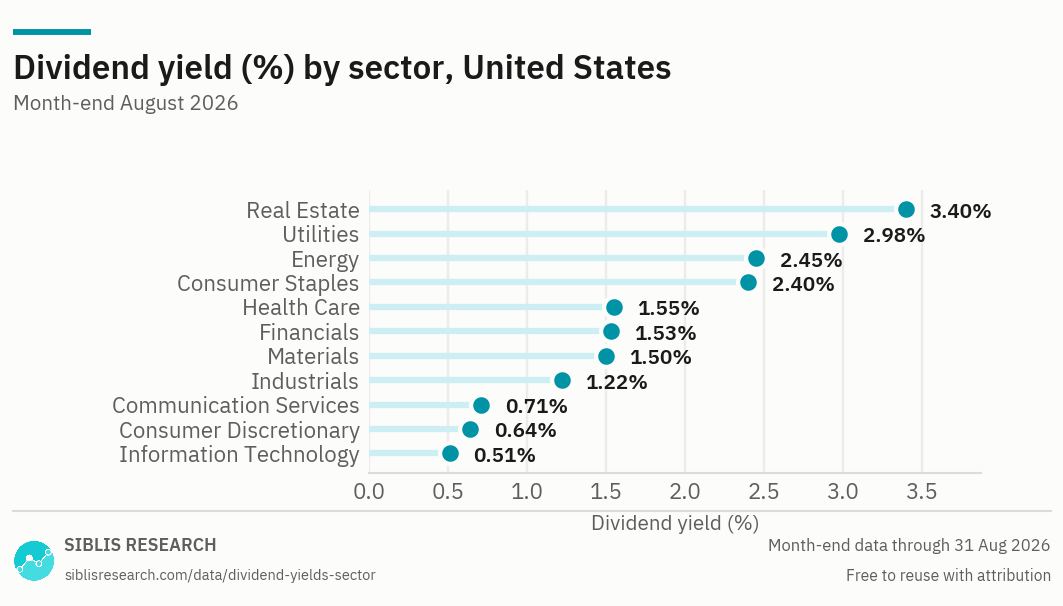
A sector's yield reflects two separate things — how much of its earnings it chooses to distribute, and how highly the market prices those earnings. A low yield is not evidence of an expensive sector on its own.
| Month | Real Estate | Utilities | Energy | Consumer Staples | Financials | Materials | Health Care | Industrials | Communication Services | Consumer Discretionary | Information Technology |
|---|---|---|---|---|---|---|---|---|---|---|---|
| Sept 2026 | 3.69% | 3.17% | 2.50% | 2.49% | 1.67% | 1.62% | 1.58% | 1.27% | 0.68% | 0.68% | 0.51% |
| 2025 Dec | 3.50% | 2.84% | 3.47% | 2.59% | 1.43% | 1.81% | 1.67% | 1.38% | 0.65% | 0.65% | 0.51% |
| 2024 Dec | 3.49% | 3.02% | 3.54% | 2.52% | 1.48% | 2.00% | 1.76% | 1.50% | 0.82% | 0.67% | 0.60% |
| 2023 Dec | 3.42% | 3.54% | 3.90% | 2.71% | 1.81% | 1.96% | 1.68% | 1.66% | 0.77% | 0.76% | 0.76% |
| 2022 Dec | 3.48% | 2.98% | 3.63% | 2.60% | 2.13% | 2.13% | 1.58% | 1.68% | 1.10% | 1.10% | 1.16% |
| 2021 Dec | 2.24% | 2.94% | 4.11% | 2.41% | 1.76% | 1.63% | 1.41% | 1.38% | 0.83% | 0.62% | 0.78% |
| 2020 Dec | 3.03% | 3.23% | 5.95% | 2.55% | 2.17% | 1.77% | 1.52% | 1.65% | 1.00% | 0.85% | 0.95% |
| 2019 Dec | 3.09% | 3.03% | 3.87% | 2.68% | 2.07% | 2.02% | 1.61% | 1.86% | 1.19% | 1.28% | 1.25% |
| 2018 Dec | 3.63% | 3.41% | 3.70% | 3.25% | 2.26% | 2.21% | 1.72% | 2.32% | 2.58% | 1.66% | 1.66% |
| 2017 Dec | 3.17% | 3.42% | 2.75% | 2.68% | 1.65% | 1.78% | 1.61% | 1.90% | 4.87% | 1.30% | 1.22% |
| 2016 Dec | 3.25% | 3.51% | 2.63% | 2.73% | 2.07% | 2.12% | 1.73% | 2.18% | 4.42% | 1.61% | 1.51% |
Sept 2026, United States
What the spread actually measures
In September 2026, Real Estate yields 3.69% and Information Technology 0.51% — a 7.2-fold gap across the eleven sectors. That gap is mostly about payout policy rather than valuation.
Sectors with stable, regulated or contracted cash flows and little use for retained capital pay most of it out: utilities, real estate, consumer staples. Sectors that can reinvest at high returns keep it: technology, consumer discretionary, communication services. Comparing the two on yield alone says more about their business models than about their prices.
Why the denominator moves
Yield is a ratio, and its denominator is price. A sector's yield rises when its dividends grow, and it also rises when its share prices fall. In a drawdown the two effects are easy to confuse: a sector can reach a decade-high yield in the same month its dividend is cut, because price fell faster than the payout did.
Energy is the clearest recent case: its yield has fallen almost a full percentage point over the past year, and price did most of that work — the sector re-rated sharply over the same twelve months.
Buybacks
Dividend yield captures only cash dividends. U.S. companies return a large and growing share of capital through share repurchases instead, and the mix differs sharply by sector. Two sectors returning the same proportion of earnings to shareholders can show very different yields here. This series is not a total-shareholder-return measure and should not be read as one.
Choosing a measure
No single ratio answers every question about a sector. Each of these pages covers the same eleven sectors — what changes is the question the measure is good at, and how far the coverage reaches.
| Measure | The question it answers | Why that one |
|---|---|---|
| EV/EBITDA | How does one sector compare across markets? | Sits above tax and debt, so it survives crossing borders. The only measure here that makes an international sector comparison sound. |
| P/E and earnings | How fast are a sector’s earnings growing? | Trailing and forward multiples with the earnings behind them, so the multiple and its denominator can be read together. |
| CAPE | Is a sector expensive against its own history? | Averages a decade of real earnings, which smooths the cycle out of the denominator. |
| Price to book | What is the market paying for the assets? | Works where earnings-based measures break down — asset-heavy sectors, and banks in particular. U.S. sectors only. |
| Dividend yield this page | Which sectors pay, and how much? | Income rather than valuation, but it moves inversely with price and is read alongside the multiples. U.S. sectors only. |
Where this data is used
Some examples. Siblis valuation data appears in peer-reviewed journals, central bank publications and the financial press.
The whole database, every trading day
This page publishes ten year-ends and the current reading. The Global Equity Valuations Database carries the full history, and every other ratio alongside it.
How this is calculated
Aggregate dividends paid by a sector's constituent companies over the previous twelve months, divided by their aggregate market capitalisation at month-end — not an average of the constituents' individual yields.
- Coverage — The eleven United States sectors. This measure is not calculated for the global or global ex-U.S. sector indices, in the free data or in the subscription. For dividend yields outside the United States, see dividend yields by country.
- Frequency — Month-end, monthly.
- Buybacks — Cash dividends only. Share repurchases are not included.
- Revisions — Figures are point-in-time. If a company later restates its results, the historic reading is left exactly as first published: the series reflects what was known at the time, not what is known now.
Cite this page
Siblis Research. (2026). Dividend Yields by Sector [Data set]. Retrieved 30 September 2026, from siblisresearch.com/data/dividend-yields-sector/
@misc{siblis_dividend_yields_sector,
  title={Dividend Yields by Sector}, author={{Siblis Research}},
  year={2026}, url={https://siblisresearch.com/data/dividend-yields-sector/},
  urldate={2026-09-30}}
Charts on this page may be reproduced free of charge with attribution to Siblis Research and a link to this page.