
FTSE 100 P/E ratio & earnings growth
Trailing and forward price-to-earnings ratios, CAPE and earnings for the United Kingdom, with history back to 1990. The multiples are calculated using the FTSE 100 index. For the same ratios across every major market check P/E ratios by country.
| Measure | Sept 2026 | Sept 2025 | Chg |
|---|---|---|---|
| Trailing P/E ratio | 14.73 | 14.08 | +0.65 |
| Forward P/E ratio | 12.02 | 12.97 | -0.95 |
| CAPE ratio | 19.60 | 19.43 | +0.17 |
Trailing P/E is aggregate market capitalisation divided by aggregate normalised net income over the previous twelve months. Forward P/E uses consensus estimates for the next twelve months.

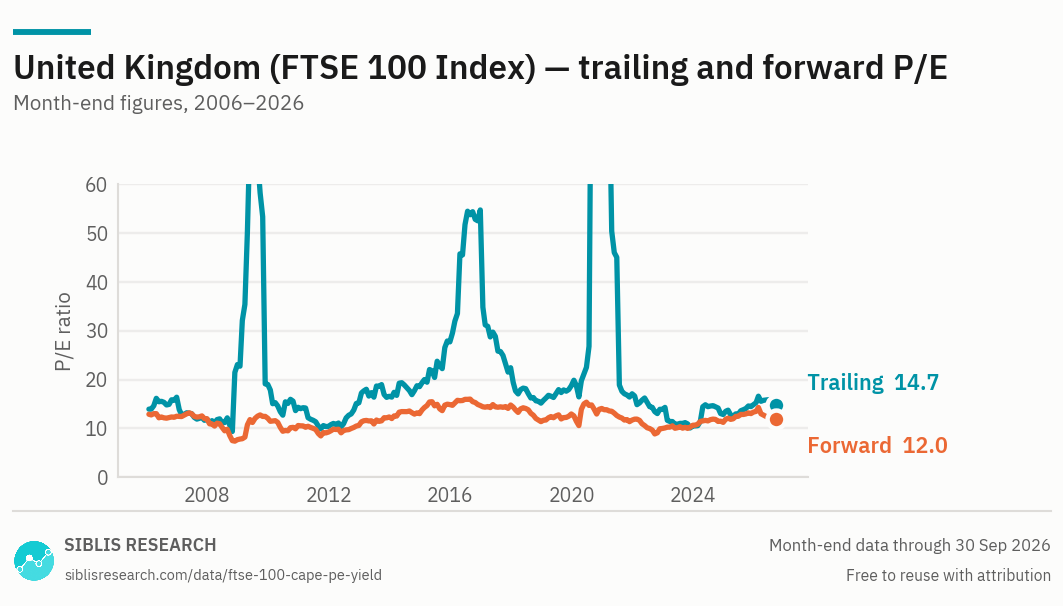
The 2020 spike above 170 is an earnings collapse rather than a re-rating: the ratio rose because the denominator fell close to zero. The values from that period should be read as a statement about collapsed earnings, not about price.

| Month | Trailing P/E | Forward P/E | CAPE | EPS index |
|---|---|---|---|---|
| Sept 2026 | 14.73 | 12.02 | 19.60 | 552.1 |
| 2025 Dec | 14.87 | 13.35 | 20.19 | 512.4 |
| 2024 Dec | 12.85 | 11.24 | 18.20 | 487.8 |
| 2023 Dec | 10.51 | 10.65 | 18.33 | 564.6 |
| 2022 Dec | 13.88 | 9.99 | 19.28 | 411.7 |
| 2021 Dec | 17.10 | 11.71 | 20.40 | 331.1 |
| 2020 Dec | 169.52 | 14.09 | 17.09 | 29.2 |
| 2019 Dec | 18.75 | 12.96 | 18.84 | 308.5 |
| 2018 Dec | 15.18 | 11.39 | 18.31 | 340.1 |
| 2017 Dec | 22.44 | 14.80 | 20.70 | 262.7 |
| 2016 Dec | 54.78 | 14.69 | 18.01 | 100.0 |
Sept 2026 at a glance
Year on year
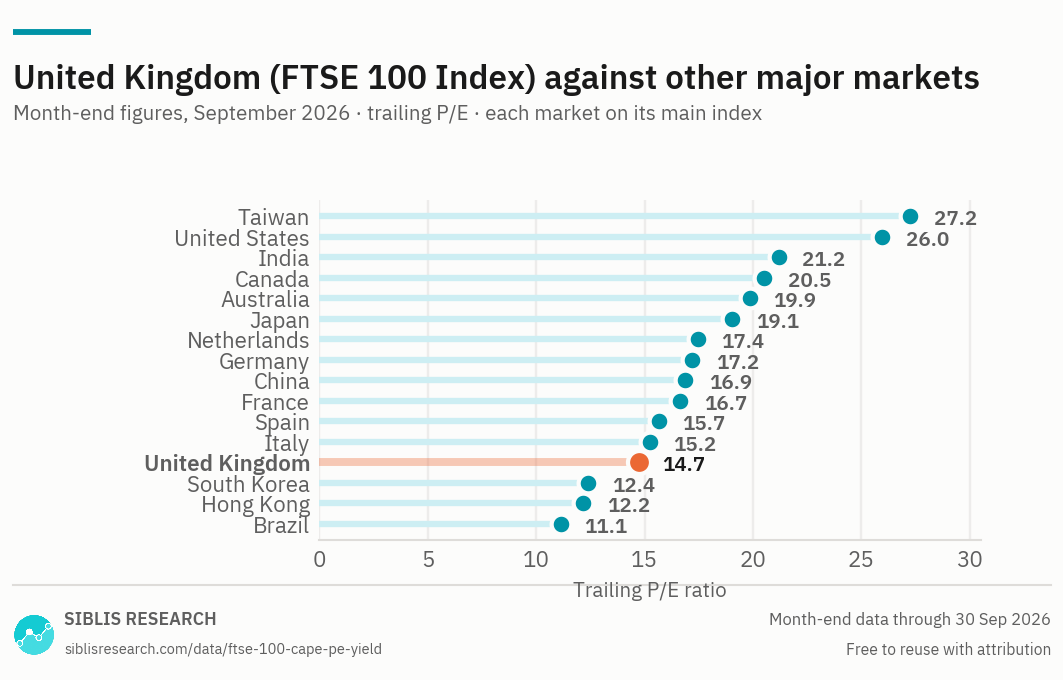
Where United Kingdom stands, September 2026
United Kingdom trades at 14.73 times trailing earnings, against 14.08 a year ago. Index earnings rose 8% over the year while the index itself rose 13%. The multiple rose because price outran earnings.
At 12.02 forward against a trailing 14.73, analysts are pricing a 23% rise in earnings over the coming twelve months. That is an expectation rather than a forecast with a track record, and the gap is worth reading as the size of what is being assumed.
Earnings Growth of FTSE 100 Companies
The earnings growth of FTSE 100 companies has experienced significant volatility in recent years, largely influenced by the pandemic and the subsequent economic environment.
During the COVID-19 pandemic, corporate earnings for FTSE 100 companies plummeted, as many industries faced severe disruptions. Lockdowns, supply chain issues, and reduced consumer spending led to a sharp decline in profitability across various sectors, especially in industries like travel, retail, and energy.
After the pandemic, earnings recovered quickly, as economies reopened and businesses adapted to new conditions. The FTSE 100 companies benefited from strong rebounds in demand, especially in sectors like consumer goods, healthcare, and commodities. Additionally, government stimulus and low interest rates helped to fuel the recovery, boosting earnings growth for many large corporations.
However, 2024 proved to be a challenging year for British companies. Earnings started to decline again, largely due to inflation and cost pressures, global economic uncertainty and geopolitical tensions (such as the ongoing impact of the Russia-Ukraine conflict), and the strong pound and the tightening of monetary policy in the UK.
Despite the struggles in 2024, earnings recovered in 2025 and continued to grow in 2026. Analysts anticipate that as inflationary pressures ease, business conditions improve, and consumer confidence rises, FTSE 100 companies will keep growing their profits. A stabilizing global economy, coupled with more favorable conditions for growth, is expected to help support a return to positive earnings growth across the index.
A UK index that is barely a UK investment
The FTSE 100's constituents earn most of their revenue outside the United Kingdom. Energy, mining, banking, pharmaceuticals and consumer staples dominate the index, and all five are global businesses priced in global end-markets.
Two consequences follow. The multiple is not a verdict on the British economy — it moves with commodity prices, global banking margins and the level of sterling far more than with domestic activity. And the sterling exchange rate works directly on reported earnings: a weaker pound raises the reported earnings of companies selling in dollars, which lowers the P/E ratio without anything changing in the underlying businesses.
The sectors, not the discount
The UK trades below most developed markets on trailing earnings, and the usual explanation is a judgement about Britain. Most of it is composition. Energy, mining and banking carry lower multiples everywhere in the world, including in the United States, and the UK index holds more of all three and less software than almost any other large developed market.
That is the same effect the Europe page describes for the continent, in a sharper form.
Read the earnings columns together
The ten-year earnings growth figure for the UK is flattered by its starting point: index earnings were depressed in 2016 by the commodity trough. The three-year figure covers the period since the post-2021 recovery ended and is much weaker. Where the two disagree this sharply, the shorter one is describing the present.
The earnings growth page shows all three horizons side by side, for every market.
Where this data is used
Some examples. Siblis valuation data appears in peer-reviewed journals, central bank publications and the financial press.
The whole database, every trading day
This page publishes one reading a month for 16 countries. The Global Equity Valuations Database is the whole thing.
How this is calculated
Aggregate market capitalisation of the index constituents divided by their aggregate earnings.
- Trailing P/E — Aggregate normalised net income over the previous twelve months. Major purely accounting gains and losses are removed.
- Forward P/E — Consensus estimates for the next twelve months, aggregated the same way.
- CAPE — Price divided by the average of ten years of inflation-adjusted aggregate earnings.
- Earnings — Shown indexed, to provide a common baseline. Index-level earnings per share in sterling are not comparable with other markets in level terms.
- Revisions — Figures are point-in-time. If a company later restates its results, the historic reading is left exactly as first published: the series reflects what was known at the time, not what is known now.
Cite this page
Siblis Research. (2026). FTSE 100 (UK) P/E Ratio & Earnings [Data set]. Retrieved 30 September 2026, from siblisresearch.com/data/ftse-100-cape-pe-yield/
@misc{siblis_ftse_100_cape_pe_yield,
  title={FTSE 100 (UK) P/E Ratio & Earnings}, author={{Siblis Research}},
  year={2026}, url={https://siblisresearch.com/data/ftse-100-cape-pe-yield/},
  urldate={2026-09-30}}
Charts on this page may be reproduced free of charge with attribution to Siblis Research and a link to this page.