
Global P/E ratios by country
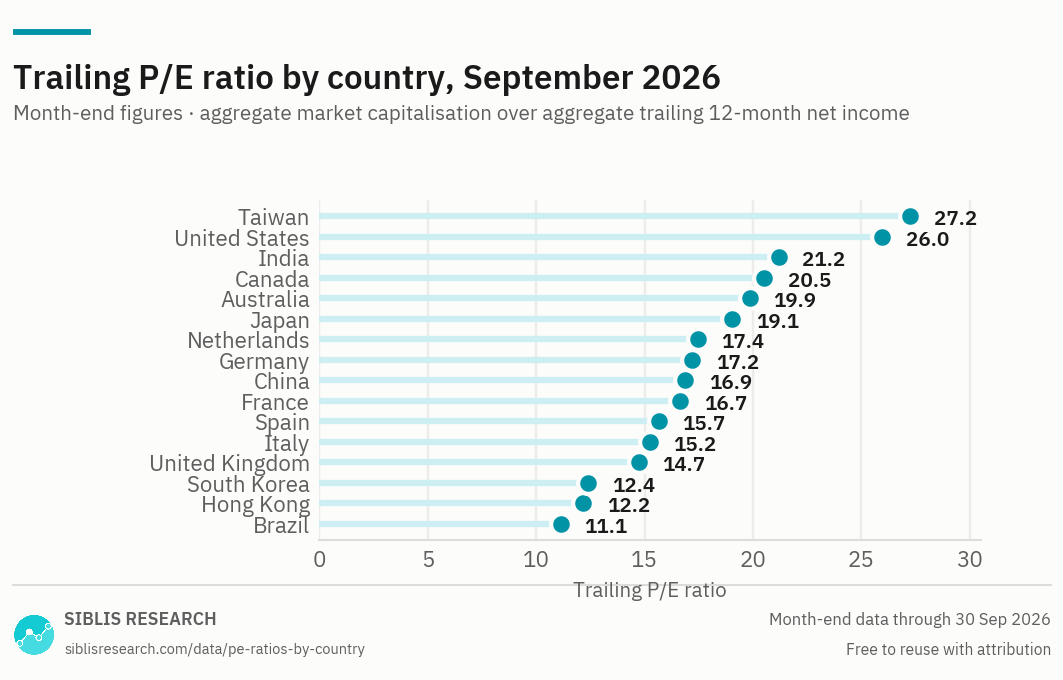
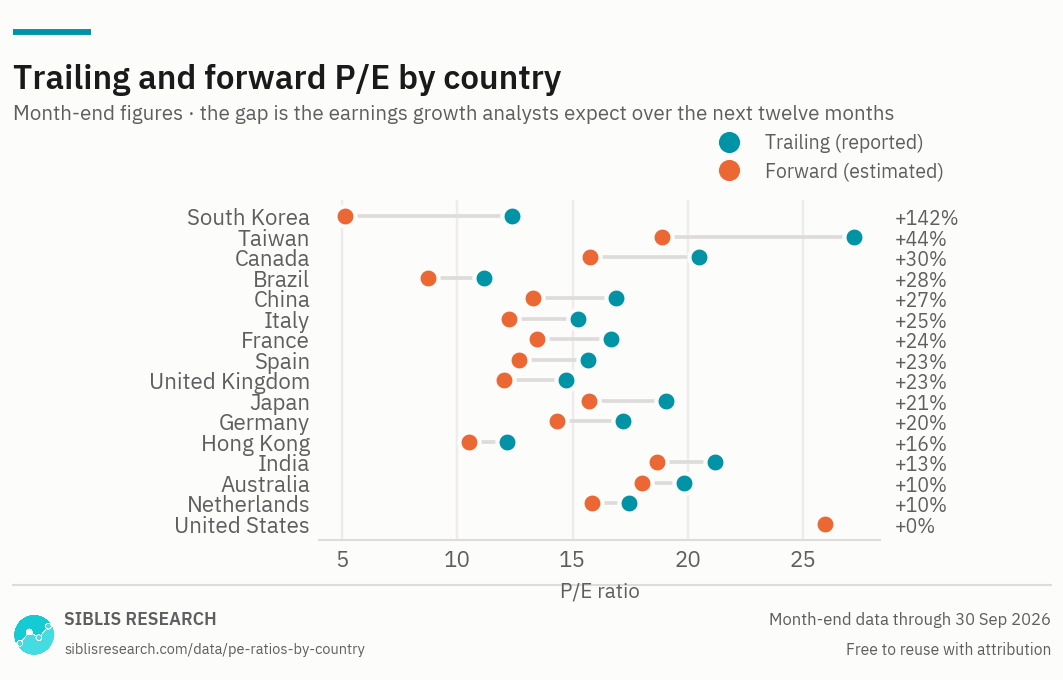
The table below provides the current trailing and forward price-to-earnings ratios for the world's largest equity markets. The table provides the multiples also for the same day a year earlier. For world, developed and emerging aggregates see global stock market P/E; for the cyclically adjusted measure see CAPE ratios by country.
| Trailing P/E | Forward P/E | |||||
|---|---|---|---|---|---|---|
| Market | Sept 2026 | Sept 2025 | Chg | Sept 2026 | Sept 2025 | Chg |
| TaiwanTWSE Index | 27.25 | 21.25 | +6.00 | 18.87 | 17.99 | +0.88 |
| United StatesU.S. Large Cap | 25.96 | 25.55 | +0.41 | 25.96 | 22.80 | +3.16 |
| IndiaNIFTY 50 Index | 21.19 | 22.81 | -1.62 | 18.68 | 21.66 | -2.98 |
| CanadaCanada Large Cap | 20.51 | 21.16 | -0.65 | 15.77 | 17.63 | -1.86 |
| AustraliaAustralia Large Cap | 19.85 | 21.22 | -1.37 | 18.01 | 19.84 | -1.83 |
| JapanNikkei 225 Index | 19.05 | 18.06 | +0.99 | 15.73 | 16.09 | -0.36 |
| NetherlandsAEX Index | 17.45 | 17.82 | -0.37 | 15.85 | 15.63 | +0.22 |
| GermanyDAX 40 Index | 17.19 | 19.82 | -2.63 | 14.34 | 15.45 | -1.11 |
| ChinaSSE Composite Index | 16.87 | 17.95 | -1.08 | 13.29 | 15.31 | -2.02 |
| FranceCAC 40 Index | 16.66 | 17.28 | -0.62 | 13.46 | 14.98 | -1.52 |
| SpainIBEX 35 Index | 15.66 | 12.80 | +2.86 | 12.69 | 12.39 | +0.30 |
| ItalyFTSE MIB Index | 15.25 | 12.54 | +2.71 | 12.22 | 11.86 | +0.36 |
| United KingdomFTSE 100 Index | 14.73 | 14.08 | +0.65 | 12.02 | 12.97 | -0.95 |
| South KoreaKOSPI Index | 12.39 | 13.29 | -0.90 | 5.11 | 10.91 | -5.80 |
| Hong KongHang Seng Index | 12.17 | 13.11 | -0.94 | 10.48 | 14.31 | -3.83 |
| BrazilBovespa Index (Ibovespa) | 11.14 | 9.62 | +1.52 | 8.71 | 9.46 | -0.75 |
Trailing P/E is aggregate market capitalisation divided by aggregate normalised net income over the previous twelve months. Forward P/E uses consensus estimates for the next twelve months.


| Month | United States | China | Germany | Japan | India | United Kingdom | France | Italy | Canada | Brazil |
|---|---|---|---|---|---|---|---|---|---|---|
| Sept 2026 | 25.96 | 16.87 | 17.19 | 19.05 | 21.19 | 14.73 | 16.66 | 15.25 | 20.51 | 11.14 |
| 2025 Dec | 25.38 | 18.06 | 18.93 | 17.88 | 23.83 | 14.87 | 17.79 | 13.53 | 20.53 | 11.45 |
| 2024 Dec | 24.61 | 15.29 | 15.04 | 15.72 | 23.96 | 12.85 | 14.09 | 8.69 | 19.36 | 8.07 |
| 2023 Dec | 21.79 | 12.82 | 14.91 | 16.40 | 23.22 | 10.51 | 13.48 | 6.94 | 15.15 | 8.72 |
| 2022 Dec | 18.55 | 13.24 | 12.50 | 13.87 | 22.13 | 13.88 | 14.72 | 10.62 | 12.53 | 5.69 |
| 2021 Dec | 26.14 | 15.45 | 15.31 | 16.19 | 24.11 | 17.10 | 22.02 | 17.69 | 18.82 | 6.80 |
| 2020 Dec | 31.05 | 17.37 | 26.95 | 31.94 | 38.45 | 169.52* | 58.86* | 44.29* | 26.80 | 33.09* |
| 2019 Dec | 21.78 | 14.55 | 22.24 | 18.97 | 28.30 | 18.75 | 21.72 | 14.18 | 16.11 | 18.73 |
| 2018 Dec | 16.77 | 11.63 | 12.41 | 14.07 | 26.17 | 15.18 | 14.79 | 10.60 | 15.32 | 16.96 |
| 2017 Dec | 21.84 | 18.16 | 18.88 | 19.10 | 26.92 | 22.44 | 18.80 | 26.22 | 18.76 | 17.99 |
| 2016 Dec | 20.59 | 15.94 | 18.20 | 20.32 | 21.49 | 54.78* | 22.20 | 68.57* | 23.00 | 96.50* |
* Earnings, not prices, moved these figures. Siblis earnings are normalised — major purely accounting gains and losses are removed — so these marks are not write-downs. They are years when real operating profits collapsed. In 2020, pandemic lockdowns cut aggregate earnings in several markets close to zero, so the ratio rises even though share prices had fallen. The 2015–2016 marks follow the collapse in commodity prices, which hit genuine earnings in the same way. A high trailing P/E in these years means earnings were depressed, not that the market was expensive.
Biggest moves on a year
Spread, Sept 2026
Widest forward gap
Where valuations stand, September 2026
The United States ended Sept 2026 at 26.0 times trailing earnings, 0.4 points higher than a year ago and the most expensive of the 16 markets here. 7 of those 16 markets are dearer than they were in Sept 2025; 9 are cheaper.
Taiwan re-rated hardest, its multiple rising 6.0 points to 27.3 over the year. At the other end, Germany fell 2.6 points to 17.2. The gap between the dearest and cheapest market on the page is 2.4 to one.
The six large European markets average 16.2 times earnings, roughly 62% of the US multiple. That discount has been a fixture for most of two decades and reflects what is listed in Europe more than what investors think of it.
Reading these numbers
Cross-market comparisons are weaker than they look. A market's multiple reflects its sector composition as much as its expensiveness, which is why the UK has looked cheap against the US for twenty years without that gap ever closing.
Trailing P/E carries a second artefact. Because earnings sit in the denominator, a collapse in earnings inflates the ratio — which is why several markets show their highest readings of the last twenty years in 2020, while prices were falling. A market can look most expensive at precisely the moment it is cheapest. The historical table above marks those years.
Where this data is used
Some examples. Siblis valuation data appears in peer-reviewed journals, central bank publications and the financial press.
The whole database, every trading day
This page publishes one reading a month for 16 countries. The Global Equity Valuations Database is the whole thing.
How this is calculated
Aggregate market capitalisation of a market's constituent companies divided by their aggregate net income over the previous twelve months — not an average of the constituents' individual P/E ratios.
- Earnings — Normalised. Major purely accounting gains and losses are removed, so the ratio reflects operating reality rather than accounting events.
- Basis — Net income after tax and interest, trailing twelve months, including companies with genuinely negative earnings.
- Forward — Consensus estimates for the next twelve months.
- Revisions — Figures are point-in-time. If a company later restates its results, the historic reading is left exactly as first published: the series reflects what was known at the time, not what is known now.
Cite this page
Siblis Research. (2026). P/E Ratios by Country [Data set]. Retrieved 30 September 2026, from siblisresearch.com/data/pe-ratios-by-country/
@misc{siblis_pe_country,
  title={P/E Ratios by Country}, author={{Siblis Research}},
  year={2026}, url={https://siblisresearch.com/data/pe-ratios-by-country/},
  urldate={2026-09-30}}
Charts on this page may be reproduced free of charge with attribution to Siblis Research and a link to this page.