
France (CAC 40) P/E ratio & earnings growth
Trailing and forward price-to-earnings ratios, CAPE and earnings for France, with history back to 1996. For the same measures across every major market see P/E ratios by country.
| Measure | Aug 2026 | Aug 2025 | Chg |
|---|---|---|---|
| Trailing P/E ratio | 17.41 | 16.85 | +0.56 |
| Forward P/E ratio | 14.27 | 14.66 | -0.39 |
| CAPE ratio | 20.53 | 20.19 | +0.34 |
Trailing P/E is aggregate market capitalisation divided by aggregate normalised net income over the previous twelve months. Forward P/E uses consensus estimates for the next twelve months.

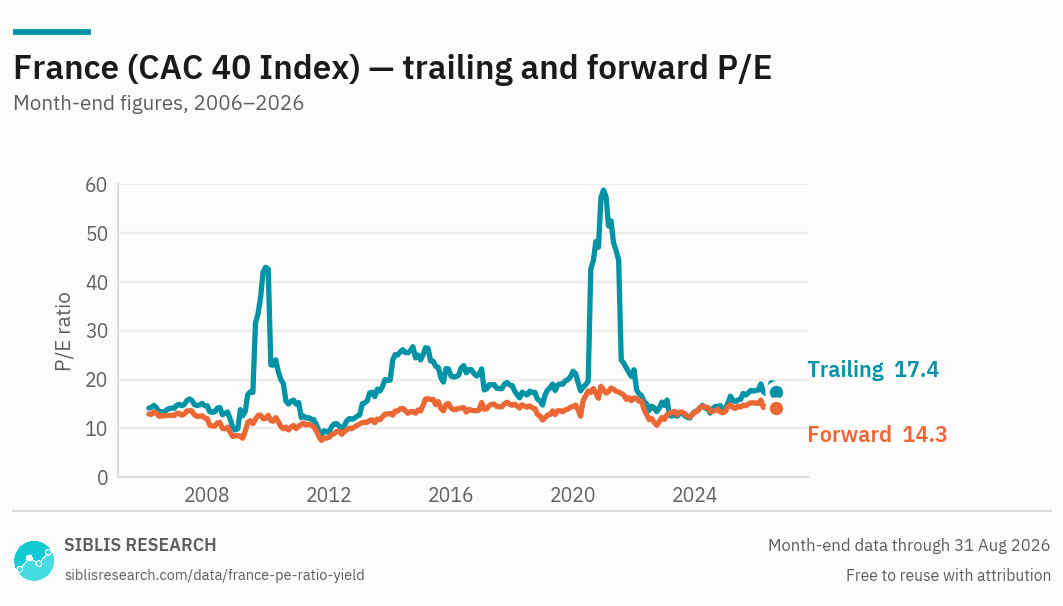
The 2000 and 2003 readings are the dot-com peak and the earnings collapse that followed. Both distort any statement about where the French multiple sits in its own range.

| Month | Trailing P/E | Forward P/E | CAPE | EPS index |
|---|---|---|---|---|
| Aug 2026 | 17.41 | 14.27 | 20.53 | 218.6 |
| 2025 Dec | 17.79 | 15.20 | 21.18 | 209.1 |
| 2024 Dec | 14.09 | 13.52 | 20.46 | 239.1 |
| 2023 Dec | 13.48 | 13.29 | 23.40 | 255.5 |
| 2022 Dec | 14.72 | 11.86 | 22.93 | 200.8 |
| 2021 Dec | 22.02 | 16.26 | 27.95 | 148.3 |
| 2020 Dec | 58.86 | 17.85 | 21.06 | 43.1 |
| 2019 Dec | 21.72 | 14.52 | 22.30 | 125.6 |
| 2018 Dec | 14.79 | 11.72 | 18.71 | 146.0 |
| 2017 Dec | 18.80 | 14.73 | 20.88 | 129.0 |
| 2016 Dec | 22.20 | 15.30 | 18.22 | 100.0 |
Aug 2026 at a glance
Year on year
Where France stands, August 2026
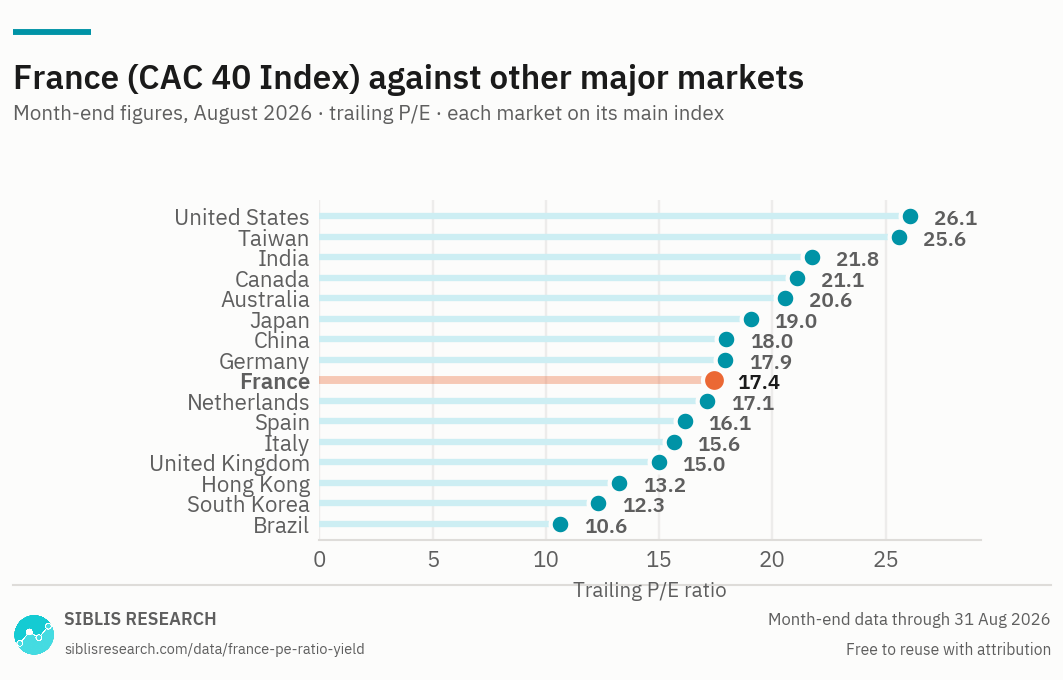
France trades at 17.41 times trailing earnings, against 16.85 a year ago. Index earnings rose 5% over the year while the index itself rose 8%. The multiple barely moved, because earnings and price travelled together.
At 14.27 forward against a trailing 17.41, analysts are pricing a 22% rise in earnings over the coming twelve months. That is an expectation rather than a forecast with a track record, and the gap is worth reading as the size of what is being assumed.
Earnings that went backwards for three years
French index earnings have fallen over the past three years while rising over five. That is not a contradiction: the five-year figure is measured from the depressed base of 2021 and captures the recovery out of it, and the three-year figure covers the period since, in which earnings have gone backwards.
Where those two horizons disagree, the shorter one describes the present. The earnings growth page puts all three side by side for every market, and France is one of several large European markets with the same shape.
The 2000 problem
Any statement about where the French multiple sits against its own history has to contend with the dot-com peak. The CAPE ratio reached the sixties in 2000, which makes almost every subsequent reading look modest by comparison and makes a position-in-range statement close to meaningless.
The useful reference period for France begins after that episode deflated.
What the index actually holds
A small number of luxury goods, industrial, energy and banking companies account for most of the index's capitalisation, and they sell into global rather than French end-markets. The multiple reflects those end-markets, not domestic activity.
For the European aggregate and the neighbouring markets that share an accounting regime and a currency, see the Europe page.
Where this data is used
Some examples. Siblis valuation data appears in peer-reviewed journals, central bank publications and the financial press.
The whole database, every trading day
This page publishes one reading a month for 16 countries. The Global Equity Valuations Database is the whole thing.
How this is calculated
Aggregate market capitalisation of the index constituents divided by their aggregate earnings.
- Trailing P/E — Aggregate normalised net income over the previous twelve months. Major purely accounting gains and losses are removed.
- Forward P/E — Consensus estimates for the next twelve months, aggregated the same way.
- CAPE — Price divided by the average of ten years of inflation-adjusted aggregate earnings.
- Earnings — Shown indexed, to provide a common baseline. Index-level earnings per share in euro are not comparable with other markets in level terms.
- Revisions — Figures are point-in-time. If a company later restates its results, the historic reading is left exactly as first published: the series reflects what was known at the time, not what is known now.
Cite this page
Siblis Research. (2026). France (CAC 40) P/E Ratio & Earnings [Data set]. Retrieved 31 August 2026, from siblisresearch.com/data/france-pe-ratio-yield/
@misc{siblis_france_pe_ratio_yield,
  title={France (CAC 40) P/E Ratio & Earnings}, author={{Siblis Research}},
  year={2026}, url={https://siblisresearch.com/data/france-pe-ratio-yield/},
  urldate={2026-08-31}}
Charts on this page may be reproduced free of charge with attribution to Siblis Research and a link to this page.