
KOSPI (South Korea) P/E ratio & earnings growth
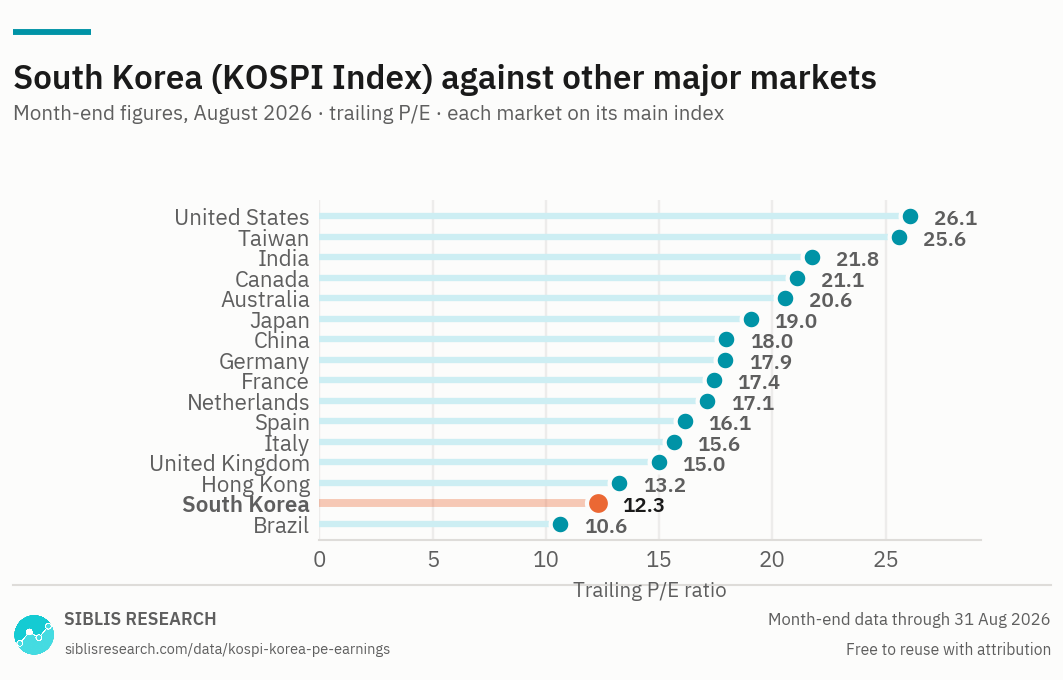
Trailing and forward price-to-earnings ratios, CAPE and earnings for the South Korean equity market. For the same measures across every major market see P/E ratios by country.
| Measure | Sept 2026 | Sept 2025 | Chg |
|---|---|---|---|
| Trailing P/E ratio | 12.39 | 13.29 | -0.90 |
| Forward P/E ratio | 5.11 | 10.91 | -5.80 |
| CAPE ratio | 31.78 | 17.44 | +14.34 |
Trailing P/E is aggregate market capitalisation divided by aggregate normalised net income over the previous twelve months. Forward P/E uses consensus estimates for the next twelve months.

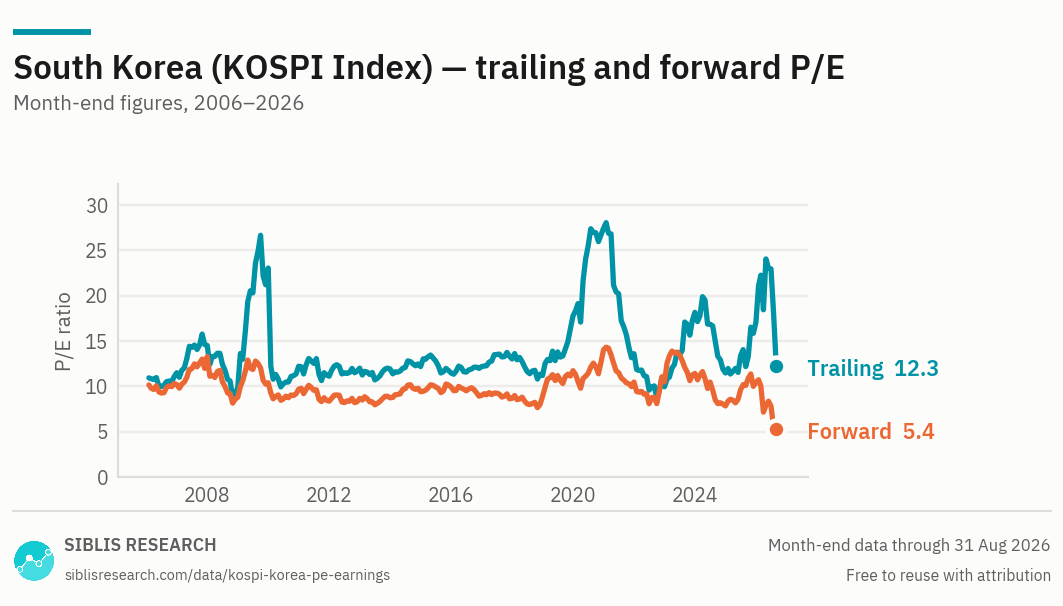
The trailing ratio peaks when earnings trough, not when prices peak — the 2020 high came from the denominator.

| Month | Trailing P/E | Forward P/E | CAPE | EPS index |
|---|---|---|---|---|
| Sept 2026 | 12.39 | 5.11 | 31.78 | 332.0 |
| 2025 Dec | 17.06 | 10.43 | 21.22 | 148.6 |
| 2024 Dec | 11.49 | 7.85 | 12.60 | 125.6 |
| 2023 Dec | 18.17 | 11.44 | 13.94 | 87.9 |
| 2022 Dec | 9.97 | 10.51 | 11.96 | 135.0 |
| 2021 Dec | 13.61 | 10.49 | 17.14 | 131.6 |
| 2020 Dec | 27.43 | 14.05 | 16.94 | 63.0 |
| 2019 Dec | 17.77 | 11.74 | 12.36 | 74.4 |
| 2018 Dec | 11.21 | 8.89 | 11.94 | 109.5 |
| 2017 Dec | 13.03 | 8.69 | 15.04 | 113.9 |
| 2016 Dec | 12.19 | 9.02 | 12.64 | 100.0 |
Sept 2026 at a glance
Year on year
Where South Korea stands, September 2026
South Korea trades at 12.39 times trailing earnings, against 13.29 a year ago. Index earnings rose 114% over the year while the index itself rose 100%. The multiple fell because earnings outran price.
At 5.11 forward against a trailing 12.39, analysts are pricing a 142% rise in earnings over the coming twelve months. That is an expectation rather than a forecast with a track record, and the gap is worth reading as the size of what is being assumed.
A market that is now two companies
South Korea's index has become extraordinarily concentrated. As of July 2026, Samsung Electronics and SK Hynix together accounted for roughly 60% of the market's total capitalisation. In practice this means the KOSPI's P/E ratio is largely a statement about two semiconductor businesses: when their earnings move, the market's multiple moves with them, and the other several hundred listed companies barely register in the aggregate.
That concentration is the single most important thing to understand before reading any Korean valuation multiple. A number that looks like a verdict on an entire economy is mostly a verdict on the memory chip cycle.
The AI cycle behind the earnings
The rally of recent years has been driven by the global build-out of AI infrastructure. SK Hynix has emerged as a leader in high-bandwidth memory, an essential component for AI accelerators, and Samsung has benefited from the same wave of demand for memory used in AI servers and data centres. Korean equities historically traded at a persistent discount to other developed markets — the so-called Korea discount — and that discount has narrowed sharply as earnings expectations improved.
Because memory is a cyclical business, the effect on reported earnings is abrupt rather than gradual. Quarterly results can move the trailing twelve-month figure by tens of percent in a single month, which is why the trailing multiple on the chart above moves in steps rather than drifting.
Why the trailing and forward ratios diverge so widely
The gap between the trailing and forward multiple is unusually large, and it is not a sign that the market is simply cheap. It reflects analysts pricing in a sharp further rise in profits over the coming twelve months, on the assumption that the AI investment cycle continues and memory demand holds.
If those forecasts are met, today's valuation may prove reasonable despite the rally. If AI-related investment slows, memory prices fall, or competition intensifies, earnings growth will fall short of what is priced in — and because so much is priced in, the correction would be correspondingly sharp. The concentration cuts both ways: the same two companies that drove the re-rating would drive the reversal.
Reading the trailing ratio through the cycle
Because earnings sit in the denominator, the trailing ratio peaks when profits trough. The readings above 27 in 2020 came from earnings collapsing, not from investors paying more for Korean equities. The opposite applies today: a low trailing multiple alongside rapidly rising earnings is a different signal from a low multiple in a stagnant market, and the two should not be read the same way.
Where this data is used
Some examples. Siblis valuation data appears in peer-reviewed journals, central bank publications and the financial press.
The whole database, every trading day
This page publishes one reading a month for 16 countries. The Global Equity Valuations Database is the whole thing.
How this is calculated
Aggregate market capitalisation of the market's constituent companies divided by their aggregate net income over the previous twelve months — not an average of the constituents' individual P/E ratios.
- Earnings — Normalised. Major purely accounting gains and losses are removed, so the ratio reflects operating reality rather than accounting events.
- Basis — Net income after tax and interest, trailing twelve months, including companies with genuinely negative earnings.
- Forward — Consensus estimates for the next twelve months.
- EPS index — Earnings are shown indexed to provide a common baseline, so growth over the period can be read directly from the column.
- Revisions — Figures are point-in-time. If a company later restates its results, the historic reading is left exactly as first published: the series reflects what was known at the time, not what is known now.
Cite this page
Siblis Research. (2026). KOSPI (South Korea) P/E Ratio [Data set]. Retrieved 30 September 2026, from siblisresearch.com/data/kospi-korea-pe-earnings/
@misc{siblis_kospi_korea_pe_earnings,
  title={KOSPI (South Korea) P/E Ratio}, author={{Siblis Research}},
  year={2026}, url={https://siblisresearch.com/data/kospi-korea-pe-earnings/},
  urldate={2026-09-30}}
Charts on this page may be reproduced free of charge with attribution to Siblis Research and a link to this page.