
European stock market valuations
Key valuation ratios for the European equity index (an index of 600 largest public companies in Europe, including the United Kingdom) and for the individual European markets behind it, with index series from 2013.
Europe's discount to the United States is the most persistent feature of cross-market valuation, and most of it is not about Europe being cheap.
| Index | Trailing P/E | Chg | Forward P/E | CAPE |
|---|---|---|---|---|
| Europethis page | 19.32 | +0.60 | 15.39 | 23.87 |
| Global | 22.07 | -0.47 | 16.91 | 29.69 |
| United States | 26.08 | +1.33 | 20.13 | 36.41 |
| Switzerland | 20.34 | +2.25 | n/a | 24.14 |
| Germany | 17.91 | -1.79 | 15.06 | 24.04 |
| France | 17.41 | +0.56 | 14.27 | 20.53 |
| Netherlands | 17.13 | +1.81 | 15.46 | 24.10 |
| Spain | 16.14 | +3.68 | 13.24 | 25.47 |
| Italy | 15.64 | +3.15 | 12.73 | 21.65 |
| Poland | 15.10 | +1.24 | n/a | 19.89 |
| United Kingdom | 14.98 | +1.14 | 12.56 | 20.27 |
| Sweden | 14.11 | -3.80 | n/a | 22.24 |
Every ratio is calculated on the aggregate: total market capitalisation divided by aggregate earnings, not an average of individual ratios.

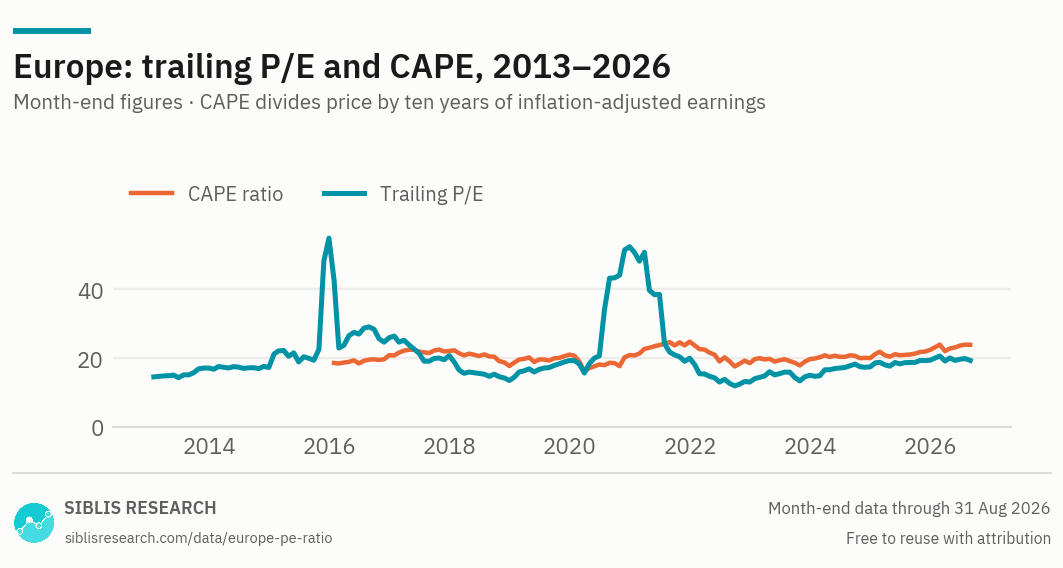
Trailing P/E runs from 2013 and CAPE from 2016, so the two lines start in different places. Where they overlap, the gap between them is the distance between current earnings and the ten-year average.

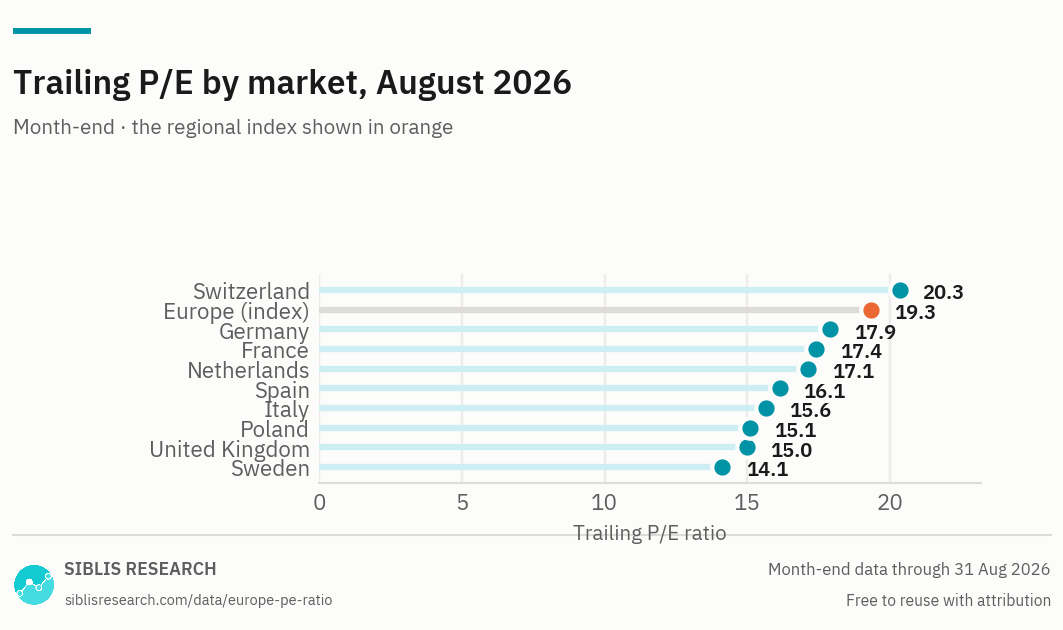
The individual markets, with the index shown in orange. The spread across European markets is narrow compared with emerging markets — these are economies with similar accounting, similar inflation and, mostly, one currency.
| Month | Europe | Global | United States |
|---|---|---|---|
| Aug 2026 | 19.32 | 22.07 | 26.08 |
| 2025 Dec | 19.38 | 23.12 | 25.38 |
| 2024 Dec | 17.44 | 21.61 | 24.61 |
| 2023 Dec | 15.00 | 20.00 | 21.79 |
| 2022 Dec | 13.05 | 16.19 | 18.55 |
| 2021 Dec | 19.96 | 20.76 | 26.14 |
| 2020 Dec | 52.37 | 27.03 | 31.05 |
| 2019 Dec | 19.29 | 19.02 | 21.78 |
| 2018 Dec | 13.49 | 15.10 | 16.77 |
| 2017 Dec | 20.73 | 20.10 | 21.84 |
| 2016 Dec | 25.93 | 20.61 | 20.59 |
Ten year-ends are published free. The complete monthly history is part of the Global Equity Valuations Database.
Aug 2026
Inside the index
Where Europe stands, August 2026
The European index trades at 19.32 times trailing earnings and 15.39 times expected earnings, with a CAPE ratio of 23.87. Switzerland is the most expensive market at 20.34 and Sweden the cheapest at 14.11.
The discount, and what actually causes it
Europe has traded below the United States for most of two decades, and the discount is usually explained as a judgement about European growth. Most of it is simpler than that.
Composition. The European indices hold more banking, energy, industrials and consumer staples, and far less software, than the American one. Those sectors carry lower multiples everywhere in the world, including in the United States. A large part of the "Europe discount" is arithmetic: a different mix of the same globally-priced sectors.
But not all of it. Holding the sector constant — comparing European software with American software, European banks with American banks — a gap remains. The sector EV/EBITDA page makes that visible: every one of the eleven sectors trades higher in the United States than outside it.
So the honest summary is that composition explains a substantial share of the discount and not all of it, and anyone claiming Europe is simply cheap is reading the first effect as though it were the second.
A narrow spread, and why that is informative
The European markets in the table above sit within a much tighter band than the emerging markets do. That is what you would expect from economies with similar accounting standards, similar inflation histories and, for most of them, a shared currency — the things that make cross-market comparison difficult elsewhere largely cancel out here.
It also means differences within Europe carry more signal than differences between regions. A European market trading well below its neighbours is making a statement about its own composition or its own outlook, not about a currency or an accounting convention.
The index history is short; the markets behind it are not
The European index trailing P/E begins in 2013 and its CAPE in 2016. Neither reaches the dot-com period, the financial crisis or the sovereign debt crisis, so any statement about Europe measured "against its own history" on the index alone is measured against roughly a decade rather than against a cycle.
The individual European markets carry considerably longer histories than the index does. For a long reference period on the region, use those instead: they are on P/E ratios by country and CAPE ratios by country.
Choosing a region
Four cuts of the same world. Each page carries the full set of valuation measures for one index — what changes is which companies are in it.
| Index | The question it answers | What is in it |
|---|---|---|
| The world market | What is the whole equity market worth? | The world aggregate and its developed and emerging halves, with trailing P/E back to 1970. |
| The world excluding the U.S. | How much of world valuation is America? | The same market with U.S. companies removed, and the gap between the two over thirty years. |
| Emerging markets | How are emerging markets valued, and which ones? | The emerging aggregate and every emerging market behind it, side by side. |
| Europe this page | How is Europe valued against itself and against the U.S.? | The European aggregate and the individual European markets. |
Where this data is used
Some examples. Siblis valuation data appears in peer-reviewed journals, central bank publications and the financial press.
Europe, market by market and day by day
This page publishes one reading a month for the index and the markets inside it. The Global Equity Valuations Database is the whole dataset.
How this is calculated
Aggregate market capitalisation of the index divided by the aggregate earnings of its constituent companies.
- Trailing P/E — Aggregate normalised net income over the previous twelve months. Index series from 2013.
- Forward P/E — Consensus estimates for the next twelve months, aggregated the same way.
- CAPE — Price divided by the average of ten years of inflation-adjusted aggregate earnings. Index series from 2016.
- Coverage — The European index, and the individual European markets carried in the database. Markets are shown geographically; a market may also appear in the emerging markets index.
- Revisions — Figures are point-in-time. If a company later restates its results, the historic reading is left exactly as first published: the series reflects what was known at the time, not what is known now.
Cite this page
Siblis Research. (2026). Europe P/E Ratio & Valuations [Data set]. Retrieved 31 August 2026, from siblisresearch.com/data/europe-pe-ratio/
@misc{siblis_europe_pe_ratio,
  title={Europe P/E Ratio & Valuations}, author={{Siblis Research}},
  year={2026}, url={https://siblisresearch.com/data/europe-pe-ratio/},
  urldate={2026-08-31}}
Charts on this page may be reproduced free of charge with attribution to Siblis Research and a link to this page.