
Dividend yields by country
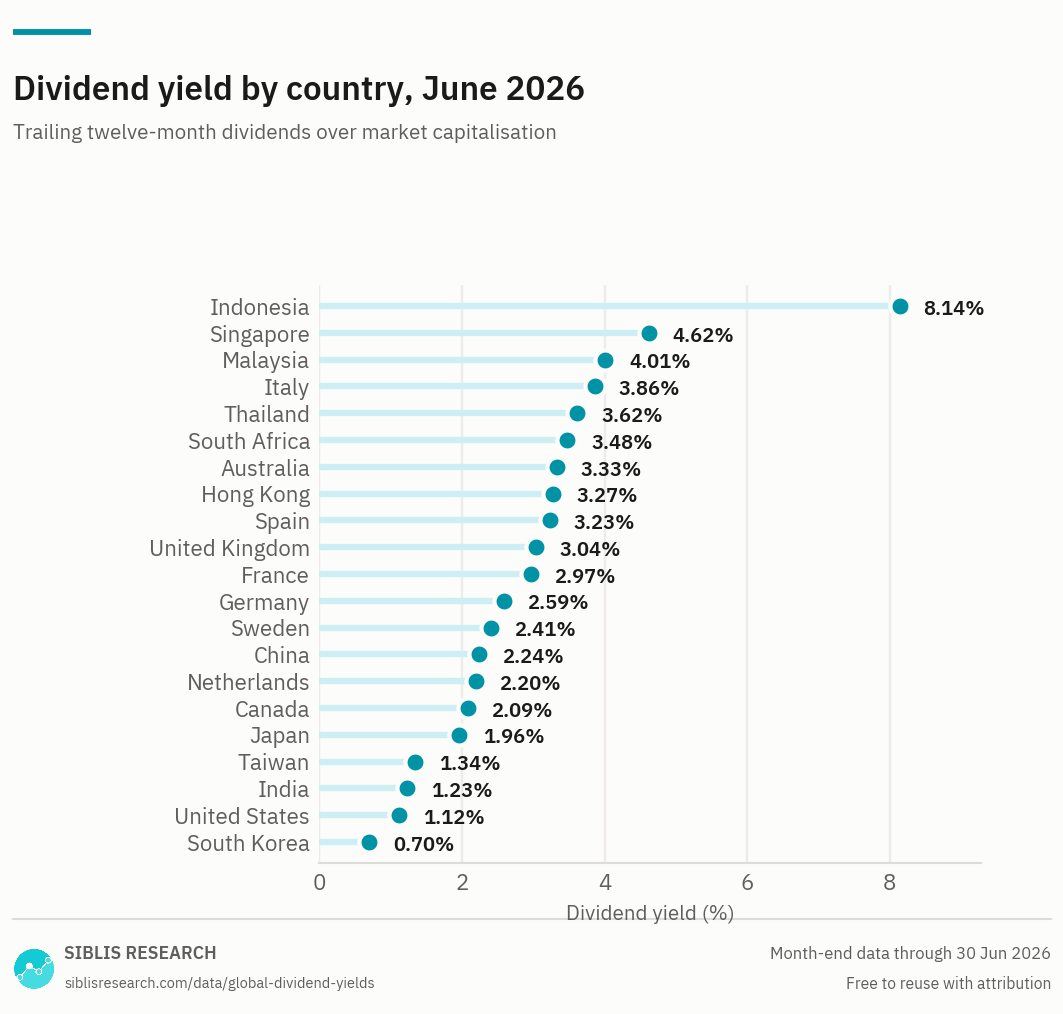
Trailing dividend yields for 21 stock markets, with ten years of history.
Yield is an income measure, not a valuation measure. It tells you what a market pays out, not what it is worth. For valuation use P/E ratios by country or CAPE ratios.
| Market | Jun 2026 | Jun 2025 | Change |
|---|---|---|---|
| Indonesia | 8.14% | 5.48% | +2.66 |
| Singapore | 4.62% | 4.83% | -0.21 |
| Malaysia | 4.01% | 4.25% | -0.24 |
| Italy | 3.86% | 4.27% | -0.41 |
| Thailand | 3.62% | 4.78% | -1.16 |
| South Africa | 3.48% | 3.10% | +0.38 |
| Australia | 3.33% | 3.29% | +0.04 |
| Hong Kong | 3.27% | 3.35% | -0.08 |
| Spain | 3.23% | 3.96% | -0.73 |
| United Kingdom | 3.04% | 3.50% | -0.46 |
| France | 2.97% | 2.49% | +0.48 |
| Germany | 2.59% | 2.49% | +0.10 |
| Sweden | 2.41% | 3.02% | -0.61 |
| China | 2.24% | 2.52% | -0.28 |
| Netherlands | 2.20% | 2.79% | -0.59 |
| Canada | 2.09% | 2.61% | -0.52 |
| Japan | 1.96% | 2.42% | -0.46 |
| Taiwan | 1.34% | 2.72% | -1.38 |
| India | 1.23% | 1.17% | +0.06 |
| United States | 1.12% | 1.26% | -0.14 |
| South Korea | 0.70% | 2.05% | -1.35 |
Aggregate dividends paid over the previous twelve months divided by aggregate market capitalisation. Change is in percentage points, against the same period a year earlier.

A market's yield reflects two separate things — how much of its earnings its companies choose to distribute, and how highly the market prices those earnings. A low yield is not evidence of an expensive market on its own.
| Period | United States | Japan | United Kingdom | Germany | France | Canada | Australia | China | Hong Kong | India |
|---|---|---|---|---|---|---|---|---|---|---|
| Jun 2026 | 1.12% | 1.96% | 3.04% | 2.59% | 2.97% | 2.09% | 3.33% | 2.24% | 3.27% | 1.23% |
| 2025 Dec | 1.18% | 2.01% | 3.10% | 2.41% | 2.94% | 2.23% | 3.17% | 2.24% | 3.09% | 1.29% |
| 2024 Dec | 1.24% | 2.12% | 3.62% | 2.80% | 3.19% | 2.92% | 3.77% | 2.69% | 3.59% | 1.25% |
| 2023 Dec | 1.50% | 2.17% | 3.86% | 3.26% | 2.98% | 3.15% | 4.02% | 2.90% | 3.97% | 1.28% |
| 2022 Dec | 1.77% | 2.36% | 3.65% | 3.68% | 2.92% | 3.21% | 4.61% | 2.64% | 3.31% | 1.27% |
| 2021 Dec | 1.29% | 1.77% | 3.37% | 2.26% | 2.03% | 2.59% | 3.60% | 1.99% | 2.54% | 1.16% |
| 2020 Dec | 1.53% | 1.89% | 3.77% | 2.55% | 1.98% | 2.93% | 2.84% | 2.02% | 3.18% | 1.14% |
| 2019 Dec | 1.80% | 1.90% | 4.36% | 2.54% | 2.96% | 3.01% | 3.95% | 2.24% | 3.52% | 1.24% |
| 2018 Dec | 1.98% | 1.90% | 4.68% | 2.71% | 3.54% | 3.45% | 4.50% | 2.70% | 4.15% | 1.24% |
| 2017 Dec | 1.83% | 1.44% | 3.81% | 2.71% | 2.34% | 2.71% | 4.13% | 1.77% | 2.98% | 1.08% |
| 2016 Dec | 2.03% | 1.71% | 3.65% | 2.47% | 3.41% | 2.76% | 4.25% | 1.83% | 3.77% | 1.35% |
Ten year-ends are published free. The complete series is part of the Global Equity Valuations Database.
Biggest moves on a year
Spread, Jun 2026
Where yields stand, June 2026
Indonesia yields 8.14%, the highest of the 21 markets here, and South Korea 0.70%, the lowest — a spread of 11.6 to one. The United States pays 1.12%.
Payout culture explains more than price does
The spread across markets is wide, and most of it is not about valuation. It is about what companies in each market are expected to do with their profits.
In several Asian and European markets a high payout ratio is the norm and a dividend cut is treated as a serious signal. In the United States a large and growing share of capital returned to shareholders goes out through share repurchases instead, which this measure does not capture at all. Two markets returning the same proportion of earnings to their owners can therefore show very different yields here.
Index composition does the rest. Markets heavy in banks, utilities, telecoms and property yield more; markets heavy in technology yield less. That is the same compositional effect that makes cross-market P/E comparisons awkward, working in the opposite direction.
Why the denominator matters
Yield is a ratio, and its denominator is price. A market's yield rises when its dividends grow, and it also rises when its share prices fall. In a drawdown the two are easy to confuse: a market can reach a decade-high yield in the same six months its dividends are being cut, because price fell faster than the payout did.
Choosing a measure
No single ratio answers every question about a market. These pages cover the same countries — what changes is the question the measure is good at.
| Measure | The question it answers | Why that one |
|---|---|---|
| P/E ratios | What does a market cost on current and expected earnings? | The standard measure, and the only page here that carries forward estimates beside the trailing figure. |
| CAPE ratios | Is a market expensive against its own past? | Ten years of inflation-adjusted earnings in the denominator, so one bad year cannot move it. |
| Earnings growth | How fast are earnings actually growing? | The denominator behind every valuation multiple, indexed so that markets in different currencies can be compared. |
| Dividend yields this page | What does a market pay out? | Income rather than valuation, though it moves inversely with price and is read alongside the multiples. |
| Market cap to GNI (GDP) | How large is a market against its own economy? | Ignores earnings entirely. The widest-angle measure here, and the one least affected by accounting. |
Where this data is used
Some examples. Siblis valuation data appears in peer-reviewed journals, central bank publications and the financial press.
The whole database, every trading day
This page publishes two readings a year. The Global Equity Valuations Database carries the full dividend history alongside every valuation ratio.
How this is calculated
Aggregate dividends paid by an index's constituent companies over the previous twelve months, divided by their aggregate market capitalisation — not an average of the constituents' individual yields.
- Coverage — Every market in the database with a dividend series. Fewer markets than the P/E and CAPE pages.
- Buybacks — Cash dividends only. Share repurchases are not included, which matters most for the United States.
- Sector yields — Published separately for the U.S. sectors on the dividend yields by sector page.
- Revisions — Figures are point-in-time. If a company later restates its results, the historic reading is left exactly as first published: the series reflects what was known at the time, not what is known now.
Cite this page
Siblis Research. (2026). Dividend Yields by Country [Data set]. Retrieved 30 June 2026, from siblisresearch.com/data/global-dividend-yields/
@misc{siblis_global_dividend_yields,
  title={Dividend Yields by Country}, author={{Siblis Research}},
  year={2026}, url={https://siblisresearch.com/data/global-dividend-yields/},
  urldate={2026-06-30}}
Charts on this page may be reproduced free of charge with attribution to Siblis Research and a link to this page.