
Global stock market valuations excluding the U.S.
The world equity index with U.S. companies removed, and the gap between American valuations and everyone else's over thirty years.
The world index is mostly one country. Almost every claim about "global valuations" is a claim about the United States wearing a different label. Removing it is the only way to see what the rest of the world is actually priced at.
| Index | Trailing P/E | Chg | Forward P/E | CAPE |
|---|---|---|---|---|
| Global ex-U.S.this page | 16.74 | -0.51 | n/a | 20.75 |
| United States | 25.96 | +0.41 | 25.96 | 35.89 |
| Global | 21.60 | -1.53 | 16.31 | 29.05 |
| Developed markets | 22.96 | -1.51 | 17.95 | 31.21 |
| Emerging markets | 15.95 | -0.47 | 9.81 | 19.06 |
Global ex-U.S. is the world index with U.S.-domiciled companies removed. It includes developed and emerging markets. Forward estimates are not calculated for this index, so the forward P/E column reads n/a — trailing P/E and CAPE are the measures to use here.

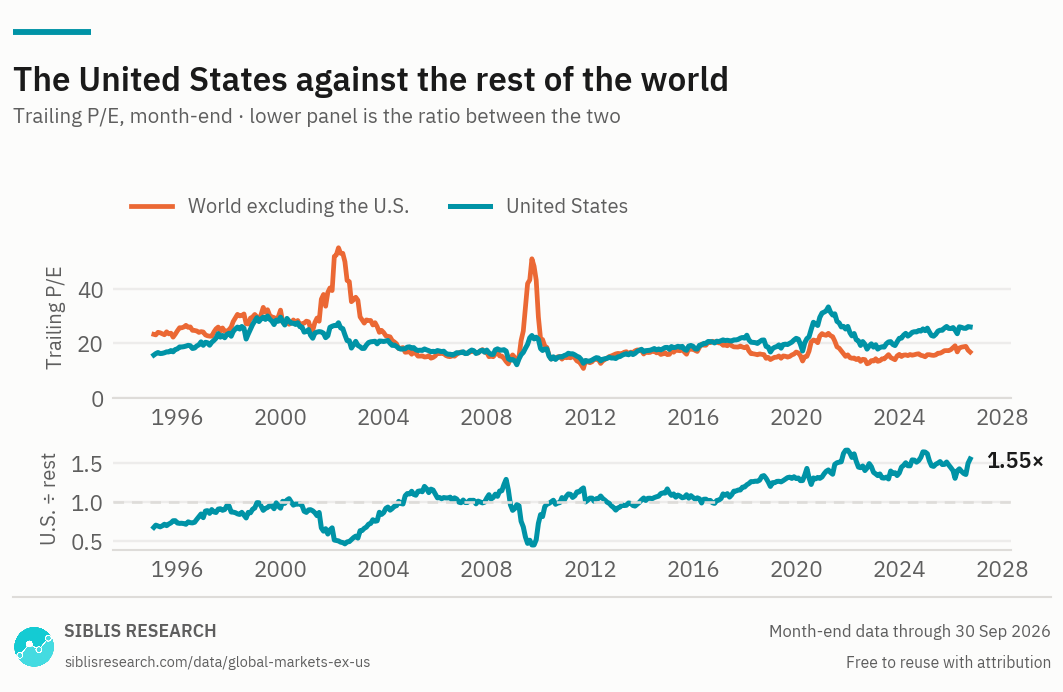
For most of the period the two lines sit on top of each other. The separation is recent, and it is the whole story.

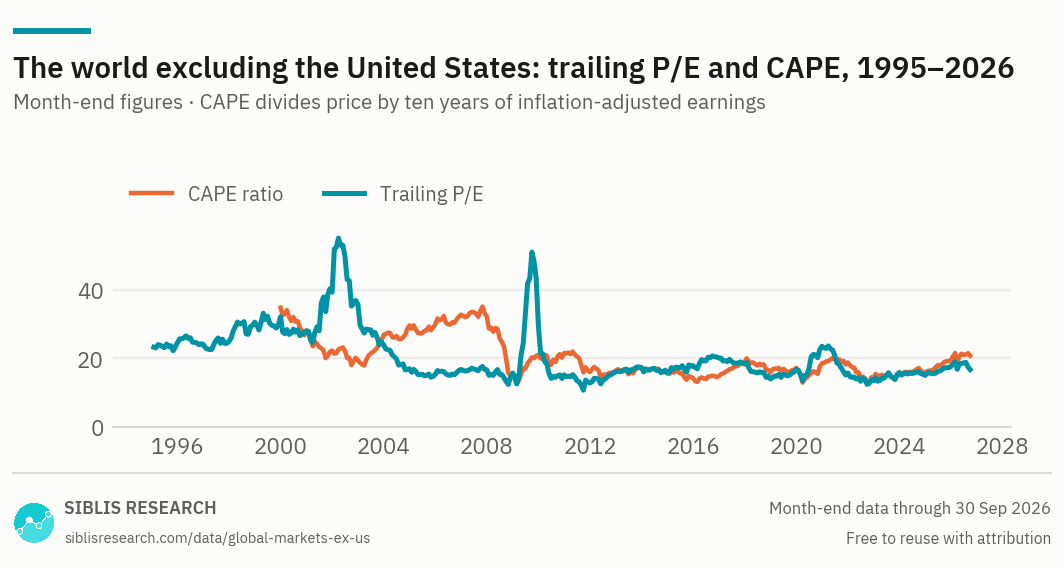
Trailing P/E and CAPE for the ex-U.S. index alone. The 2002 and 2009 spikes are earnings collapses, not re-ratings: the ratio rose because the denominator fell.
| Month | Global ex-U.S. | United States | Global | Developed markets | Emerging markets |
|---|---|---|---|---|---|
| Sept 2026 | 16.74 | 25.96 | 21.60 | 22.96 | 15.95 |
| 2025 Dec | 17.65 | 25.38 | 23.12 | 24.49 | 16.98 |
| 2024 Dec | 15.01 | 24.61 | 21.61 | 22.67 | 15.13 |
| 2023 Dec | 15.89 | 21.79 | 20.00 | 21.18 | 14.67 |
| 2022 Dec | 13.45 | 18.55 | 16.19 | 17.18 | 12.18 |
| 2021 Dec | 15.71 | 26.14 | 20.76 | 22.67 | 14.02 |
| 2020 Dec | 23.52 | 31.05 | 27.03 | 28.57 | 21.28 |
| 2019 Dec | 16.76 | 21.78 | 19.02 | 20.24 | 15.14 |
| 2018 Dec | 13.99 | 16.77 | 15.10 | 16.07 | 11.98 |
| 2017 Dec | 18.33 | 21.84 | 20.10 | 20.78 | 15.93 |
| 2016 Dec | 20.10 | 20.59 | 20.61 | 21.88 | 14.35 |
Ten year-ends are published free. The complete monthly series, for both sides of the comparison, is part of the Global Equity Valuations Database.
Sept 2026
Where the rest of the world stands, September 2026
The ex-U.S. index trades at 16.74 times trailing earnings with a CAPE ratio of 20.75. The United States trades at 26.0 — 1.55 times the ex-U.S. multiple.
The gap is new, and that is the finding
For most of the past thirty years the two multiples were close enough to be interchangeable. The ratio in the lower panel of the chart above crossed above and below one as each side took its turn, and before 2015 it sat below one in 159 of 240 months. On trailing earnings, the rest of the world was more often the expensive half.
That stopped. The last month in which the United States traded below the rest of the world was October 2016 — 119 months ago. The premium peaked at 1.66 times in December 2021 and stands at 1.55 times today. Whatever explains it, it is a regime that has now lasted a decade, not a swing within the old pattern.
Three explanations, and what each is worth
Sector composition. The U.S. index holds more software and less banking than the rest of the world, and software carries a higher multiple everywhere. This is the most common explanation and it is partly right. It is not sufficient: holding the sector constant, as the sector EV/EBITDA page does, still leaves every one of the eleven sectors trading at a premium in the United States.
Earnings growth. A market that grows faster deserves a higher multiple. U.S. index earnings have grown faster than the rest of the world's over the period, and part of the premium is that. How much is a question about the future rather than about the data.
Concentration. The U.S. index multiple is increasingly a statement about a small number of very large companies. An aggregate cannot show that; the dispersion between U.S. sectors can.
The honest position is that the first explains some of it, the second explains some of it, and neither of them explains all of it.
Choosing a region
Four cuts of the same world. Each page carries the full set of valuation measures for one index — what changes is which companies are in it.
| Index | The question it answers | What is in it |
|---|---|---|
| The world market | What is the whole equity market worth? | The world aggregate and its developed and emerging halves, with trailing P/E back to 1970. |
| The world excluding the U.S. this page | How much of world valuation is America? | The same market with U.S. companies removed, and the gap between the two over thirty years. |
| Emerging markets | How are emerging markets valued, and which ones? | The emerging aggregate and every emerging market behind it, side by side. |
| Europe | How is Europe valued against itself and against the U.S.? | The European aggregate and the individual European markets. |
Where this data is used
Some examples. Siblis valuation data appears in peer-reviewed journals, central bank publications and the financial press.
Both sides of the comparison, in full
This page publishes twenty year-ends of the ex-U.S. index. The Global Equity Valuations Database carries the full monthly series for both sides of every comparison on it.
How this is calculated
Aggregate market capitalisation of the index divided by the aggregate earnings of its constituent companies, with U.S.-domiciled companies excluded from the index.
- Trailing P/E — Aggregate normalised net income over the previous twelve months.
- CAPE — Price divided by the average of ten years of inflation-adjusted aggregate earnings.
- Forward P/E — Not calculated for this index.
- Coverage — Developed and emerging markets, excluding the United States. Trailing P/E from 1995; CAPE from 1999.
- Revisions — Figures are point-in-time. If a company later restates its results, the historic reading is left exactly as first published: the series reflects what was known at the time, not what is known now.
Cite this page
Siblis Research. (2026). Global Stock Market Excluding the U.S. [Data set]. Retrieved 30 September 2026, from siblisresearch.com/data/global-markets-ex-us/
@misc{siblis_global_markets_ex_us,
  title={Global Stock Market Excluding the U.S.}, author={{Siblis Research}},
  year={2026}, url={https://siblisresearch.com/data/global-markets-ex-us/},
  urldate={2026-09-30}}
Charts on this page may be reproduced free of charge with attribution to Siblis Research and a link to this page.