
Brazil (Ibovespa) P/E ratio & earnings growth
Trailing and forward price-to-earnings ratios, CAPE and earnings for Brazil, with history back to 1996. For the same measures across every major market see P/E ratios by country.
| Measure | Aug 2026 | Aug 2025 | Chg |
|---|---|---|---|
| Trailing P/E ratio | 10.63 | 9.29 | +1.34 |
| Forward P/E ratio | 8.37 | 8.60 | -0.23 |
| CAPE ratio | 14.34 | 13.42 | +0.92 |
Trailing P/E is aggregate market capitalisation divided by aggregate normalised net income over the previous twelve months. Forward P/E uses consensus estimates for the next twelve months.

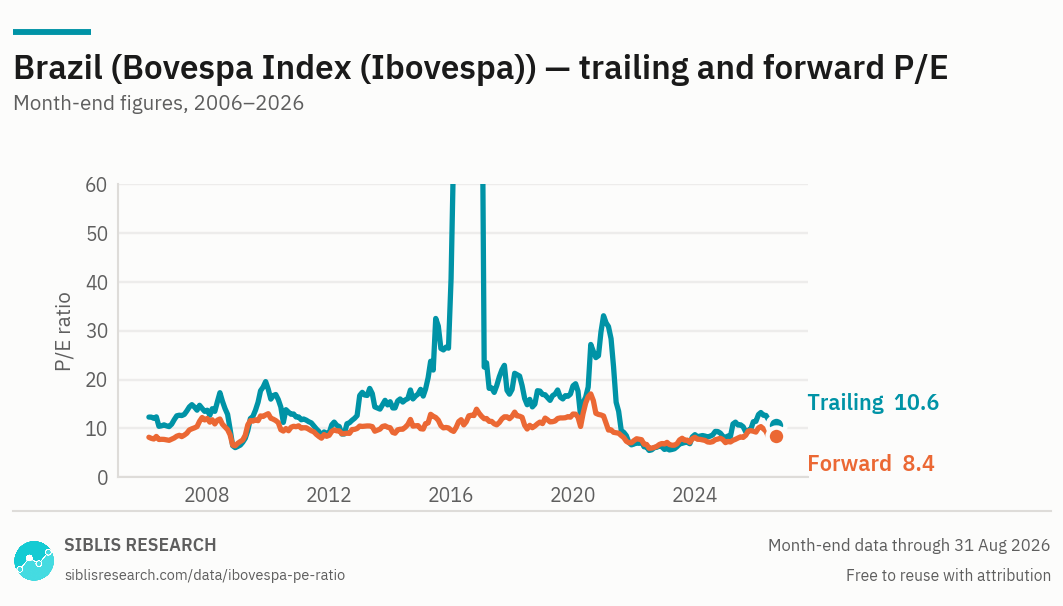
The 2016 spike above 100 is the earnings trough of the Brazilian recession, not a valuation peak. The ratio rose because the denominator nearly disappeared.

| Month | Trailing P/E | Forward P/E | CAPE | EPS index |
|---|---|---|---|---|
| Aug 2026 | 10.63 | 8.37 | 14.34 | 2675.6 |
| 2025 Dec | 11.45 | 9.25 | 14.64 | 2254.1 |
| 2024 Dec | 8.07 | 7.09 | 12.62 | 2389.7 |
| 2023 Dec | 8.72 | 8.18 | 16.34 | 2466.1 |
| 2022 Dec | 5.69 | 6.81 | 16.21 | 3088.2 |
| 2021 Dec | 6.80 | 7.51 | 18.59 | 2468.7 |
| 2020 Dec | 33.09 | 12.55 | 23.04 | 576.4 |
| 2019 Dec | 18.73 | 12.95 | 21.77 | 989.1 |
| 2018 Dec | 16.96 | 10.99 | 16.60 | 830.2 |
| 2017 Dec | 17.99 | 12.49 | 13.99 | 680.4 |
| 2016 Dec | 96.50 | 12.48 | 10.62 | 100.0 |
Aug 2026 at a glance
Year on year
Where Brazil stands, August 2026
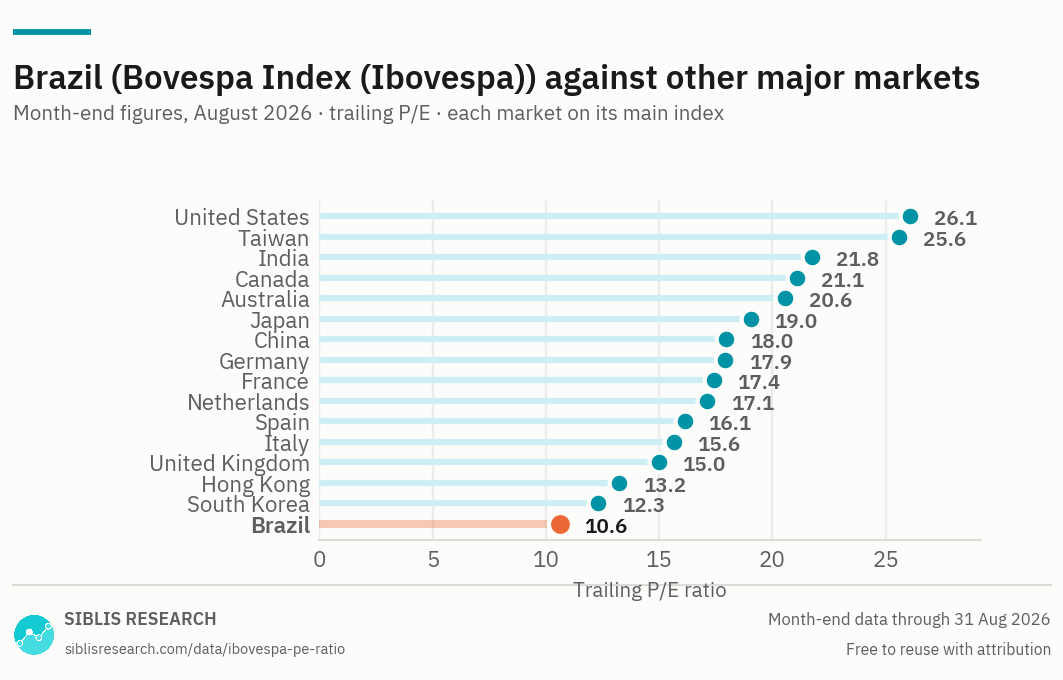
Brazil trades at 10.63 times trailing earnings, against 9.29 a year ago. Index earnings rose 10% over the year while the index itself rose 25%. The multiple rose because price outran earnings.
At 8.37 forward against a trailing 10.63, analysts are pricing a 27% rise in earnings over the coming twelve months. That is an expectation rather than a forecast with a track record, and the gap is worth reading as the size of what is being assumed.
Read the earnings growth as nominal, because it is
Brazilian index earnings are reported in reais, and the growth figures here are nominal — they are not adjusted for inflation. Over a decade in which Brazilian inflation was substantial, a large nominal growth rate can coexist with very little real progress.
The ten-year figure is flattered twice over: by inflation, and by a starting point in the depths of the 2015–16 recession, when index earnings had collapsed. The three-year and five-year columns are far more modest and far more informative.
This is the general problem with cross-market growth comparisons, and the earnings growth page sets out why the markets worth taking seriously are the ones whose horizons agree.
A low multiple is not only a valuation
Brazil trades on one of the lowest trailing multiples of any market covered here. Part of that is what is listed — commodities, banks and utilities carry lower multiples everywhere. Part of it is the discount rate: a market where domestic interest rates have spent long periods in double figures prices its equities against a very different alternative from one where rates are near zero.
Neither part is a judgement about the companies, and neither shows up in the ratio itself.
The currency does the rest
These ratios are calculated in a common currency. A market whose currency has weakened will show a falling multiple even when nothing about its companies has changed, and over a decade the real's moves have been large enough to dominate any comparison with a developed market.
Where this data is used
Some examples. Siblis valuation data appears in peer-reviewed journals, central bank publications and the financial press.
The whole database, every trading day
This page publishes one reading a month for 16 countries. The Global Equity Valuations Database is the whole thing.
How this is calculated
Aggregate market capitalisation of the index constituents divided by their aggregate earnings.
- Trailing P/E — Aggregate normalised net income over the previous twelve months. Major purely accounting gains and losses are removed.
- Forward P/E — Consensus estimates for the next twelve months, aggregated the same way.
- CAPE — Price divided by the average of ten years of inflation-adjusted aggregate earnings.
- Earnings — Shown indexed, to provide a common baseline. Index-level earnings per share in reais are not comparable with other markets in level terms.
- Revisions — Figures are point-in-time. If a company later restates its results, the historic reading is left exactly as first published: the series reflects what was known at the time, not what is known now.
Cite this page
Siblis Research. (2026). Brazil (Ibovespa) P/E Ratio & Earnings [Data set]. Retrieved 31 August 2026, from siblisresearch.com/data/ibovespa-pe-ratio/
@misc{siblis_ibovespa_pe_ratio,
  title={Brazil (Ibovespa) P/E Ratio & Earnings}, author={{Siblis Research}},
  year={2026}, url={https://siblisresearch.com/data/ibovespa-pe-ratio/},
  urldate={2026-08-31}}
Charts on this page may be reproduced free of charge with attribution to Siblis Research and a link to this page.