
FTSE 100 index sector weightings
The share of the FTSE 100 held in each equity sector, as of 31 December 2025.
Financials is the largest sector at 26.15%, followed by Consumer Staples at 15.15% and Industrials at 14.94%. The shape of this index is the reason UK market returns behave differently from American ones.
| Sector | Dec 2025latest |
|---|---|
| Financials | 26.15% |
| Consumer Staples | 15.15% |
| Industrials | 14.94% |
| Health Care | 13.79% |
| Energy | 9.45% |
| Materials | 7.09% |
| Consumer Discretionary | 4.91% |
| Utilities | 4.43% |
| Communications | 2.16% |
| Information Technology | 0.98% |
| Real Estate | 0.94% |
| Telecommunications (discontinued) | — |
Weights are the share of total index value in each sector at the date shown, and sum to 100%. A sector with no constituents in the index that year shows 0.00%; a dash means the sector did not exist under the classification in use at the time.

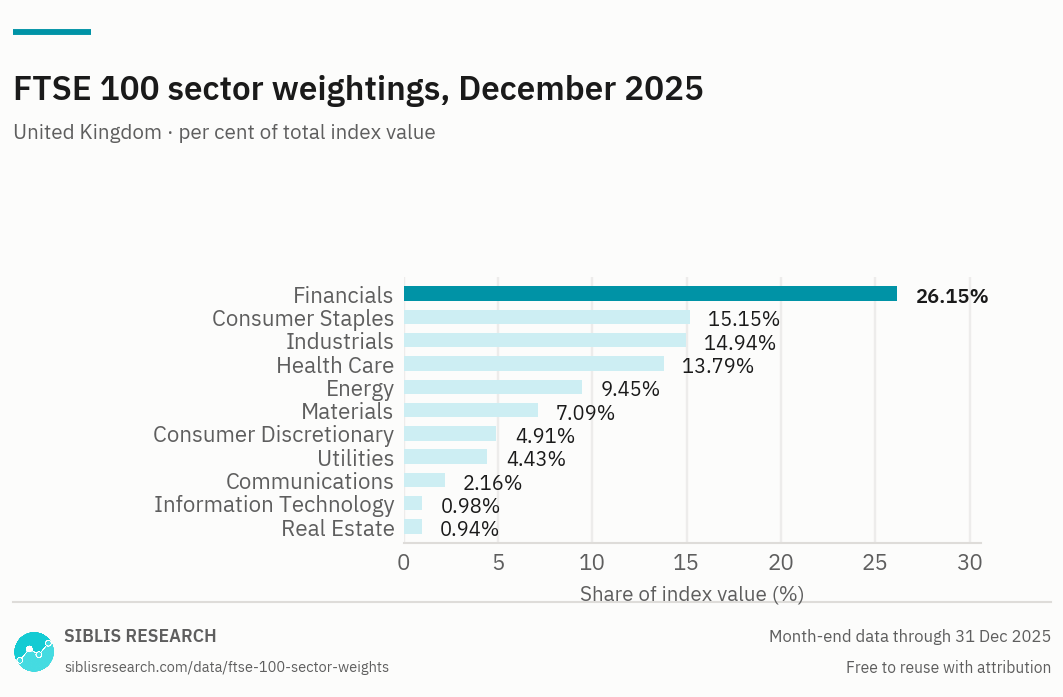
11 sectors, ranked by share of index value. The two smallest are Information Technology and Real Estate, together under 2% of the index.
What this index is made of
The FTSE 100 is the benchmark for the United Kingdom's largest listed companies, and its sector mix is unusual among developed-market indices: heavy in financials, consumer staples, energy and materials, and almost empty of technology.
Information Technology is 11th of eleven sectors at under 1% of the index. For comparison, technology is the largest sector in the U.S. market by a wide margin. An investor holding the FTSE 100 and an investor holding a U.S. large cap index own very different businesses, and the gap in their returns over the past decade is largely a sector story rather than a valuation one.
The index is also concentrated in a handful of names. A small group of the largest constituents — pharmaceuticals, energy, banking and consumer goods — accounts for roughly a third of it, so index-level figures are substantially statements about those companies.
Why sector weights matter for reading a valuation
A market's P/E ratio is partly a statement about what it costs and partly a statement about what it contains. An index dominated by banks and energy will carry a lower multiple than one dominated by software, in every period, without either being cheap or dear relative to the other.
That is worth holding in mind when comparing the UK's multiple with the American one: some of the gap is sector mix rather than sentiment. The P/E ratios by sector page shows what each sector costs, which is the other half of the comparison.
How these weights are compiled
- Source — Constituent-level sector classification and index weights, aggregated to sector level.
- Basis — Weights are the share of total index value held by each sector at the date shown, and sum to 100%.
- Frequency — Compiled once a year, at year end. The date on the table is the date the weights refer to.
- Sectors — The standard eleven-sector scheme. Communications replaced Telecommunications when the classification changed, so the two are shown as separate rows where the history spans that change.