
Germany (DAX) P/E ratio & earnings growth
Trailing and forward price-to-earnings ratios, CAPE and earnings for the German equity market, with history back to 1996. For the same measures across every major market see P/E ratios by country.
| Measure | Aug 2026 | Aug 2025 | Chg |
|---|---|---|---|
| Trailing P/E ratio | 17.91 | 19.70 | -1.79 |
| Forward P/E ratio | 15.06 | 15.46 | -0.40 |
| CAPE ratio | 24.04 | 24.06 | -0.02 |
Trailing P/E is aggregate market capitalisation divided by aggregate normalised net income over the previous twelve months. Forward P/E uses consensus estimates for the next twelve months.

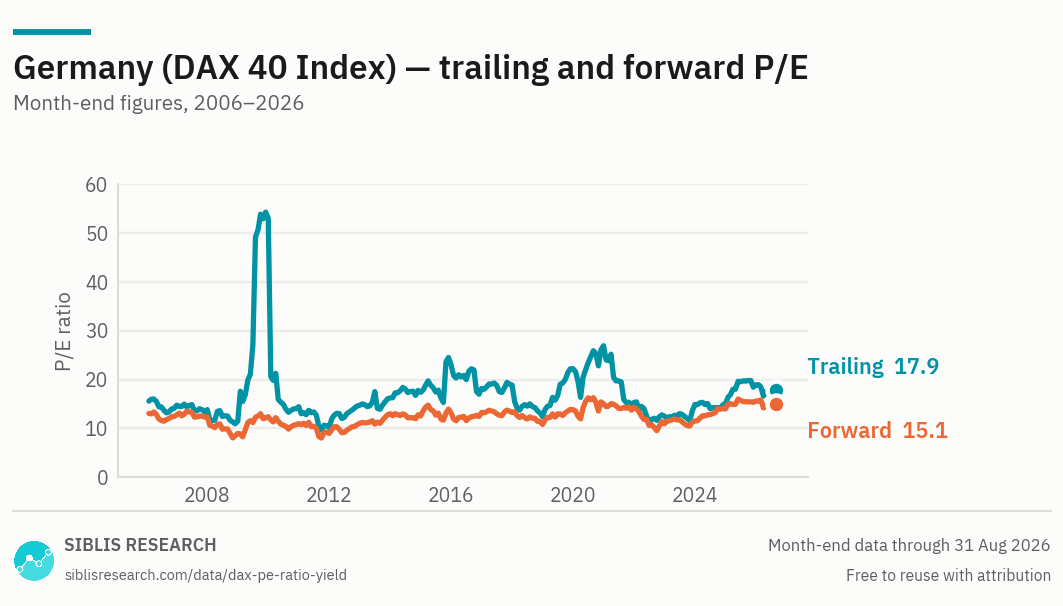
The range from under 10 to over 90 is a property of a concentrated index rather than of the German market: one large constituent having a bad year moves the aggregate denominator sharply.

| Month | Trailing P/E | Forward P/E | CAPE | EPS index |
|---|---|---|---|---|
| Aug 2026 | 17.91 | 15.06 | 24.04 | 232.5 |
| 2025 Dec | 18.93 | 15.62 | 24.08 | 205.1 |
| 2024 Dec | 15.04 | 13.99 | 21.08 | 209.9 |
| 2023 Dec | 14.91 | 11.52 | 19.30 | 178.2 |
| 2022 Dec | 12.50 | 10.96 | 17.53 | 176.6 |
| 2021 Dec | 15.31 | 14.34 | 23.37 | 164.5 |
| 2020 Dec | 26.95 | 15.06 | 21.85 | 80.7 |
| 2019 Dec | 22.24 | 13.83 | 21.31 | 94.5 |
| 2018 Dec | 12.41 | 10.81 | 18.67 | 134.9 |
| 2017 Dec | 18.88 | 13.27 | 24.55 | 108.5 |
| 2016 Dec | 18.20 | 13.29 | 22.42 | 100.0 |
Aug 2026 at a glance
Year on year
Where Germany stands, August 2026
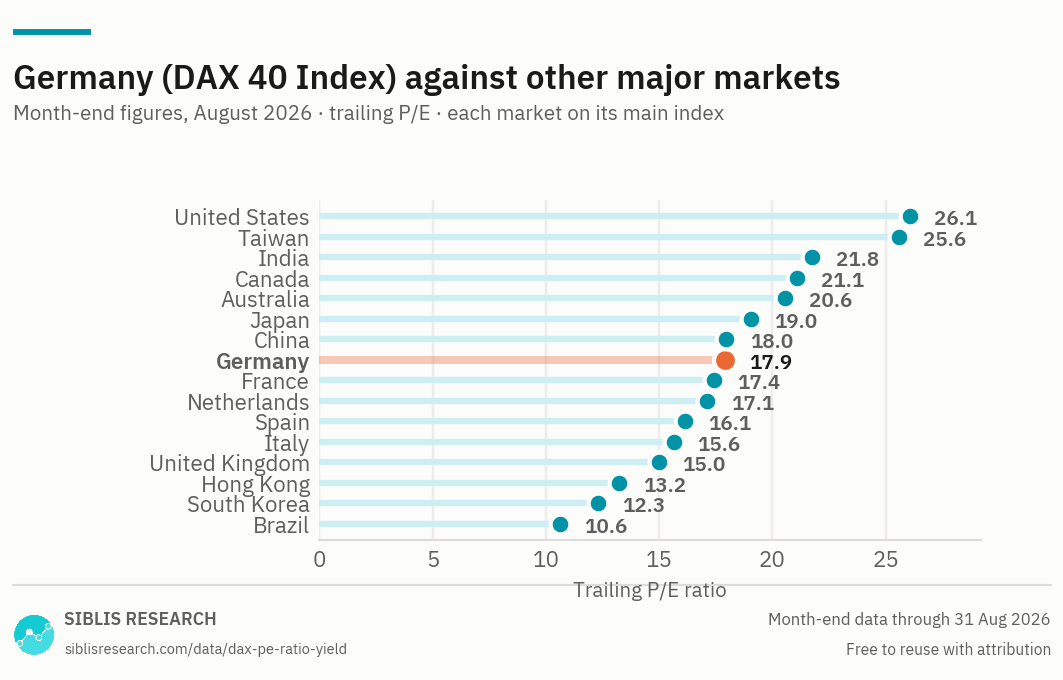
Germany trades at 17.91 times trailing earnings, against 19.70 a year ago. Index earnings rose 21% over the year while the index itself rose 10%. The multiple fell because earnings outran price.
At 15.06 forward against a trailing 17.91, analysts are pricing a 19% rise in earnings over the coming twelve months. That is an expectation rather than a forecast with a track record, and the gap is worth reading as the size of what is being assumed.
A market that got cheaper while it rose
German index earnings have roughly tripled over the past ten years, compounding at about 12% a year. Over the same period the trailing P/E ratio fell, from 22.2 in August 2016 to 17.9 in August 2026.
A market whose earnings triple while its multiple contracts is one where the profits arrived and the re-rating did not. Whatever has driven German equities over the decade, an increase in what investors are willing to pay per unit of earnings is not it.
A small index, and what that does to the ratio
The German index is concentrated by construction: a small number of large industrial, chemical, software and financial companies account for most of its capitalisation. Two consequences follow.
The first is volatility in the ratio. A single large constituent having a bad year moves the aggregate denominator in a way it would not in a broader index — which is why the trailing P/E has a historical range running from under 10 to over 90, far wider than the underlying market ever justified.
The second is that this is not a ratio about the German economy. The constituents earn most of their revenue outside Germany, and their multiples reflect global end-markets rather than domestic conditions.
Where to read Germany against
The most useful comparison for a German multiple is not its own long history — the 2000 and 2003 readings distort that — but the European aggregate and the other large European markets, which share accounting conventions, a currency and much of the same sector composition. Those sit together on the Europe page.
Where this data is used
Some examples. Siblis valuation data appears in peer-reviewed journals, central bank publications and the financial press.
The whole database, every trading day
This page publishes one reading a month for 16 countries. The Global Equity Valuations Database is the whole thing.
How this is calculated
Aggregate market capitalisation of the index constituents divided by their aggregate earnings.
- Trailing P/E — Aggregate normalised net income over the previous twelve months. Major purely accounting gains and losses are removed.
- Forward P/E — Consensus estimates for the next twelve months, aggregated the same way.
- CAPE — Price divided by the average of ten years of inflation-adjusted aggregate earnings.
- Earnings — Shown indexed, to provide a common baseline. Index-level earnings per share in euro are not comparable with other markets in level terms.
- Revisions — Figures are point-in-time. If a company later restates its results, the historic reading is left exactly as first published: the series reflects what was known at the time, not what is known now.
Cite this page
Siblis Research. (2026). Germany (DAX) P/E Ratio & Earnings [Data set]. Retrieved 31 August 2026, from siblisresearch.com/data/dax-pe-ratio-yield/
@misc{siblis_dax_pe_ratio_yield,
  title={Germany (DAX) P/E Ratio & Earnings}, author={{Siblis Research}},
  year={2026}, url={https://siblisresearch.com/data/dax-pe-ratio-yield/},
  urldate={2026-08-31}}
Charts on this page may be reproduced free of charge with attribution to Siblis Research and a link to this page.