
China (SSE Composite) P/E ratio & earnings growth
Trailing and forward price-to-earnings ratios, CAPE and earnings for the Chinese equity market, calculated using the SSE Composite stock index, with history back to 1998. It is important to note that major Chinese technology companies, including Alibaba Group, Tencent, Xiaomi, & Meituan, are listed on the Hong Kong Stock Exchange and are not included in the SSE Composite. The Shanghai stock market is primarily dominated by large mainland banks and industrial firms. For the same measures across every major market see P/E ratios by country.
| Measure | Aug 2026 | Aug 2025 | Chg |
|---|---|---|---|
| Trailing P/E ratio | 17.96 | 16.69 | +1.27 |
| Forward P/E ratio | 14.21 | 15.16 | -0.95 |
| CAPE ratio | 17.79 | 17.21 | +0.58 |
Trailing P/E is aggregate market capitalisation divided by aggregate normalised net income over the previous twelve months. Forward P/E uses consensus estimates for the next twelve months.

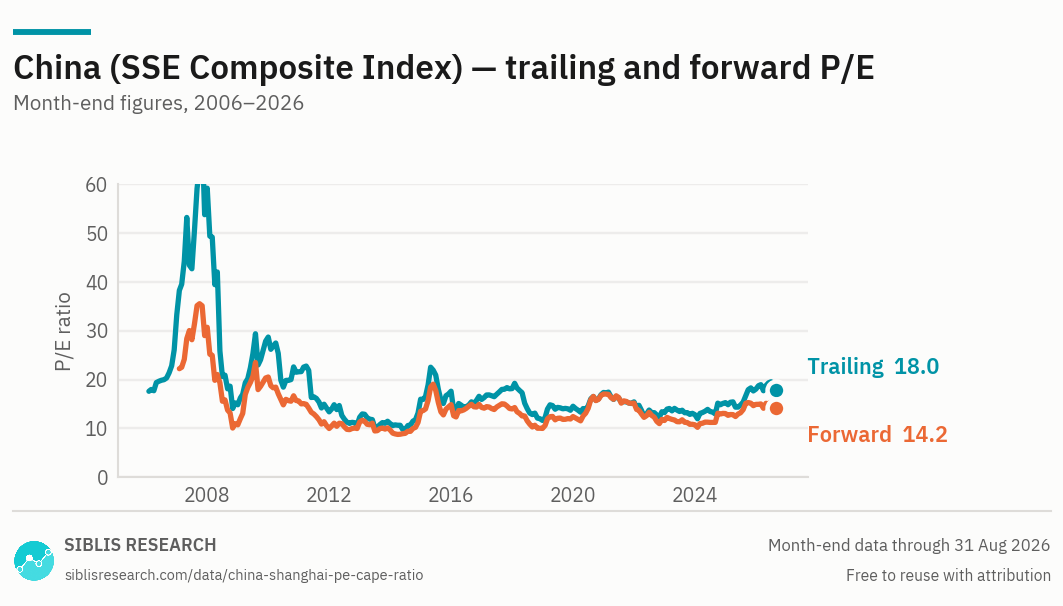
The 2007 peak near 70 is the reference point that makes every later reading look modest. A range produced by a speculative episode is a poor yardstick for the market that exists now.

| Month | Trailing P/E | Forward P/E | CAPE | EPS index |
|---|---|---|---|---|
| Aug 2026 | 17.96 | 14.21 | 17.79 | 114.0 |
| 2025 Dec | 18.06 | 14.93 | 17.71 | 112.8 |
| 2024 Dec | 15.29 | 13.05 | 14.98 | 112.6 |
| 2023 Dec | 12.82 | 10.74 | 13.18 | 119.2 |
| 2022 Dec | 13.24 | 11.63 | 13.73 | 119.9 |
| 2021 Dec | 15.45 | 15.19 | 16.59 | 121.0 |
| 2020 Dec | 17.37 | 17.06 | 16.47 | 102.7 |
| 2019 Dec | 14.55 | 12.43 | 14.70 | 107.7 |
| 2018 Dec | 11.63 | 10.00 | 12.92 | 110.1 |
| 2017 Dec | 18.16 | 13.99 | 18.05 | 93.5 |
| 2016 Dec | 15.94 | 14.30 | 18.02 | 100.0 |
Aug 2026 at a glance
Year on year
Where China stands, August 2026
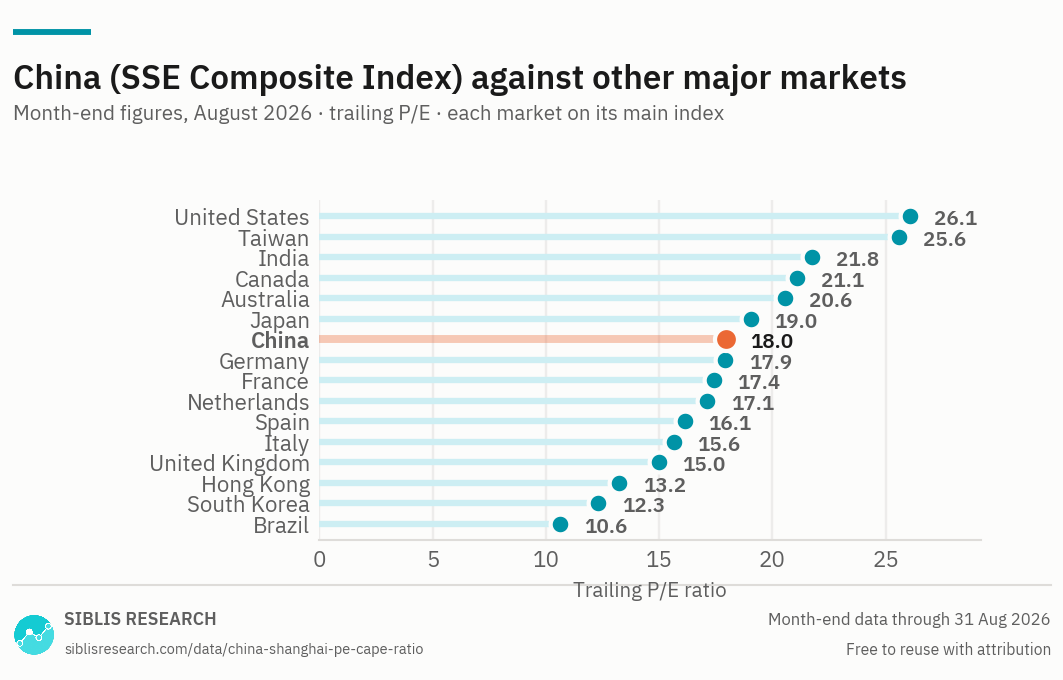
China trades at 17.96 times trailing earnings, against 16.69 a year ago. Index earnings fell 4% over the year while the index itself rose 3%. The multiple rose because price outran earnings.
At 14.21 forward against a trailing 17.96, analysts are pricing a 26% rise in earnings over the coming twelve months. That is an expectation rather than a forecast with a track record, and the gap is worth reading as the size of what is being assumed.
A decade in which earnings went nowhere
Chinese index earnings are roughly where they were ten years ago. Compounded, they have grown at about 1% a year over that period, and they are lower now than a year ago.
This is what makes China difficult to read on any earnings-based multiple. In a market where the denominator is flat, the P/E ratio becomes almost purely a chart of the price — it moves when sentiment moves, and carries very little information about the businesses underneath.
The forward multiple is below the trailing one
That is the reverse of the usual arrangement, and it is a statement about expectations: analysts are forecasting that earnings recover over the coming year. The gap between the two numbers is the size of the recovery being priced in.
Forward estimates are expectations, not forecasts with a track record, and in a market where earnings have disappointed for a decade they deserve more scepticism than usual. But the direction is worth noting, because it is not what the trailing series alone would suggest.
The 2007 problem, and why "cheap against its own history" misleads here
The CAPE ratio for China sits near the bottom of its own historical range, which reads as extremely cheap. The reason is the other end of that range: the 2007 bubble, when the CAPE ratio passed 109 and the trailing P/E approached 70.
A range whose upper end was produced by a speculative episode nobody expects to repeat is not a useful reference. Measured against the period since 2011 — which is most of the history and all of the modern market structure — the current reading is unremarkable rather than exceptional.
What the index actually holds
The Shanghai Composite is heavily weighted towards banks, industrials and state-linked enterprises, and lightly weighted towards the consumer technology businesses most foreign investors associate with China, many of which are listed in Hong Kong or the United States. A valuation ratio for this index is a statement about the former, not the latter.
Where this data is used
Some examples. Siblis valuation data appears in peer-reviewed journals, central bank publications and the financial press.
The whole database, every trading day
This page publishes one reading a month for 16 countries. The Global Equity Valuations Database is the whole thing.
How this is calculated
Aggregate market capitalisation of the index constituents divided by their aggregate earnings.
- Trailing P/E — Aggregate normalised net income over the previous twelve months. Major purely accounting gains and losses are removed.
- Forward P/E — Consensus estimates for the next twelve months, aggregated the same way.
- CAPE — Price divided by the average of ten years of inflation-adjusted aggregate earnings.
- Earnings — Shown indexed, to provide a common baseline. Index-level earnings per share in yuan are not comparable with other markets in level terms.
- Revisions — Figures are point-in-time. If a company later restates its results, the historic reading is left exactly as first published: the series reflects what was known at the time, not what is known now.
Cite this page
Siblis Research. (2026). China (SSE Composite) P/E ratio and earnings [Data set]. Retrieved 31 August 2026, from siblisresearch.com/data/china-shanghai-pe-cape-ratio/
@misc{siblis_china_shanghai_pe_cape_ratio,
  title={China (SSE Composite) P/E ratio and earnings}, author={{Siblis Research}},
  year={2026}, url={https://siblisresearch.com/data/china-shanghai-pe-cape-ratio/},
  urldate={2026-08-31}}
Charts on this page may be reproduced free of charge with attribution to Siblis Research and a link to this page.