
Communication Services sector valuation
American communication services trade at 18.14 times trailing earnings against 16.89 for the rest of the world — a premium of +7%, the smallest of the eleven sectors and the only one anywhere near parity.
On EV/EBITDA the same comparison gives +71%. Two measures of the same companies, the same day, and they do not agree about whether America is expensive.
United States The four headline readings below are for the U.S. communication services sector. The same six measures for the global and global ex-U.S. communication services sectors are in the table that follows.
| Measure | United States | Global | Global ex-U.S. | U.S. premium |
|---|---|---|---|---|
| Trailing P/E | 18.14 | 17.88 | 16.89 | +7% |
| Forward P/E | 18.79 | 17.78 | 14.52 | +29% |
| CAPE | 36.51 | 31.62 | 20.26 | +80% |
| EV/EBITDA | 14.62 | 12.86 | 8.55 | +71% |
| Price to book | 4.97 | — | — | — |
| Dividend yield | 0.68% | — | — | — |
Global covers developed markets, emerging markets and the United States. Global ex-U.S. is the same universe with the United States removed, and still includes both developed and emerging markets. Dividend yield and price to book are published for the U.S. sectors only. Free to reuse with attribution.

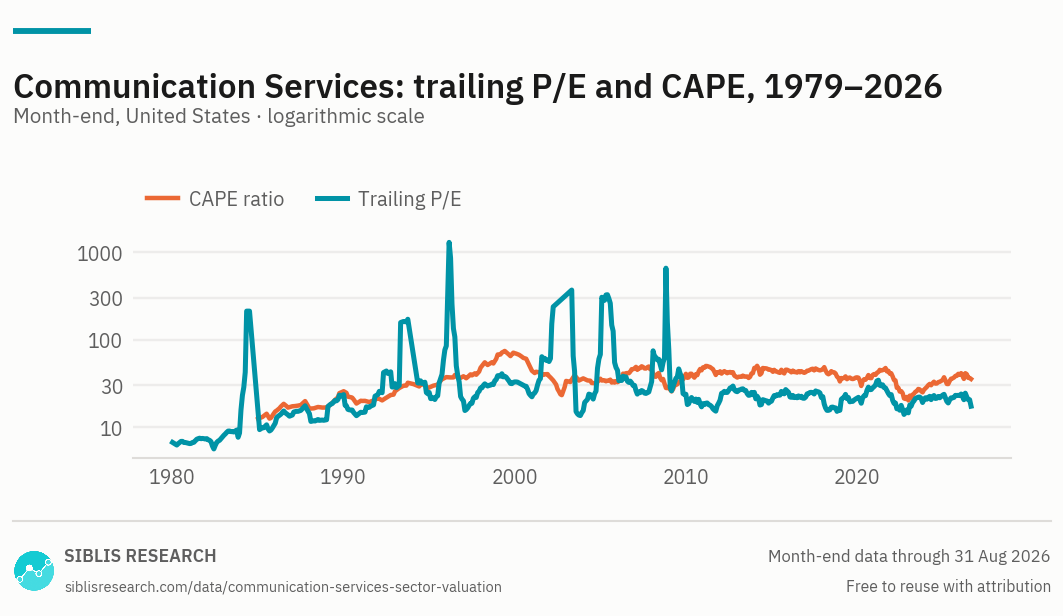
Trailing P/E and CAPE, U.S., from 1979, drawn logarithmically. The two lines are further apart here than in any other sector: current earnings sit 2.01 times their own inflation-adjusted decade average.

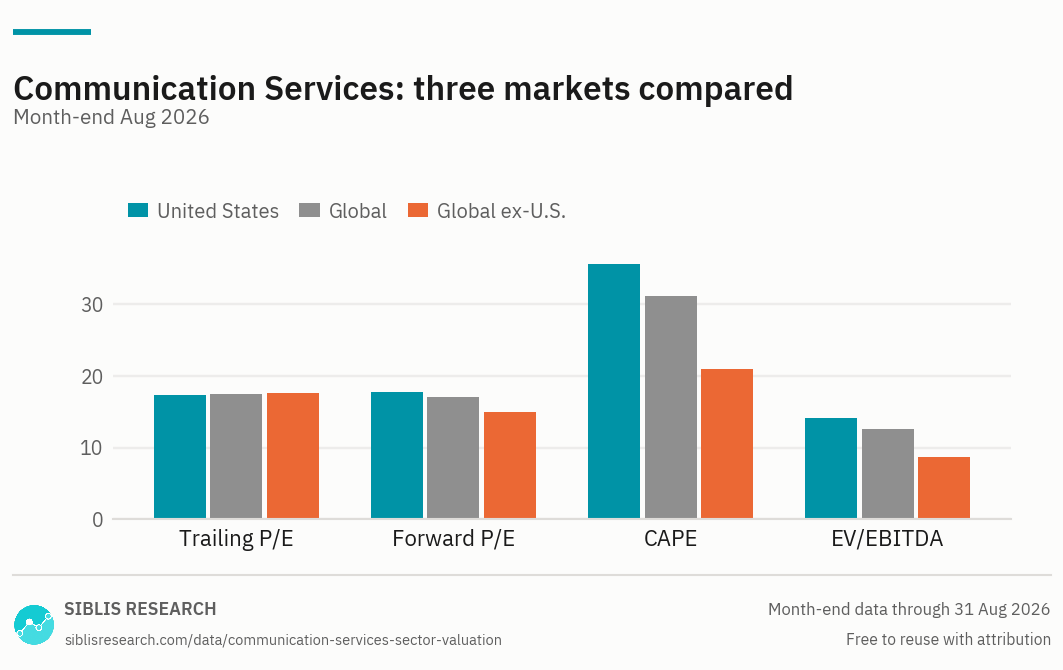
The same four measures, side by side in each market published. The P/E column and the EV/EBITDA column tell opposite stories about the American premium.
| Year | Trailing P/E | CAPE |
|---|---|---|
| 2025 | 22.96 | 39.77 |
| 2024 | 23.23 | 34.58 |
| 2023 | 21.71 | 27.82 |
| 2022 | 14.59 | 20.23 |
| 2021 | 23.59 | 41.28 |
| 2020 | 29.16 | 40.51 |
| 2019 | 21.47 | 37.14 |
| 2018 | 15.59 | 33.33 |
| 2017 | 22.35 | 45.95 |
| 2016 | 22.14 | 42.62 |
The full monthly history from 1979, and the global and global ex-U.S. series, are available to subscribers.
United States, Sept 2026
U.S. sector against its own history
The premium that is only there on one measure
P/E ignores how a company is financed. It divides the value of the equity by the earnings that belong to the equity, and a company that borrowed heavily to build its network is treated the same as one that did not.
EV/EBITDA does the opposite. It adds net debt to the market value, and measures earnings before interest — so a balance sheet full of borrowing raises the numerator without touching the denominator.
On trailing earnings the U.S. premium is +7%. On EV/EBITDA it is +71%. When one measure says parity and the other says a large premium, the difference between them is the debt, and the conclusion is uncomfortable for the cheaper-looking side: the international sector is not cheaper, it is more heavily borrowed.
That is not a criticism of those businesses. Fixed-line and mobile networks are financed with debt almost everywhere outside the United States, and the returns have historically justified it. It is a warning about the comparison. An investor screening this sector on P/E alone and concluding that non-U.S. companies offer the same earnings for less money is reading a number that has been constructed to ignore the thing that differs most.
Price to book says something the earnings measures cannot
The price to book of 4.97 sits at the 96th percentile of its history since 1979, and it is one of the highest readings of the eleven sectors.
That is not a contradiction of the low trailing P/E above. It is the same fact from the other side. A business whose assets are licences, catalogues, subscriber relationships and brands carries very little of its productive capacity on the balance sheet, so a high price to book here is partly an accounting artefact rather than a valuation signal.
What it does establish is that the earnings, not the assets, are what is being bought — which puts the weight back on the question of whose earnings, in a sector whose composition changed inside the period being measured.
The history describes a different industry
This sector was redefined in 2018. Before that it held telephone companies: regulated, slow, capital-heavy, and valued accordingly. Afterwards it held advertising, interactive media and entertainment, moved across from technology and consumer discretionary.
The series here is calculated on the current definition throughout, which makes it internally consistent, but no amount of consistency changes what the sector actually was for most of the period being averaged.
That matters for CAPE more than for anything else, because CAPE explicitly reaches back ten years. Today's reading is 36.51, at the 50th percentile of a history starting in 1984. Read it as a valuation of the current sector against the earnings of a partly different one, and treat the percentile as the weakest statistic on this page rather than the strongest.
The trailing P/E of 18.14 sits at the 30th percentile of its own history, which is low, and the price to book of 4.97 sits at the 96th percentile, which is not. Two measures, two answers, and the same caution applies to both.
The forward multiple points the wrong way
Almost every sector's forward P/E sits below its trailing P/E, because consensus estimates almost always expect earnings to be higher next year than last.
Here the forward P/E is 18.79 against a trailing 18.14 — a step of +4%. The implied change in aggregate earnings over the next twelve months is -3%, against growth of 41.8% over the last twelve months and 20.9% a year over five.
A forward multiple above the trailing one is the market saying that the recent past was unusually good. It is the single most useful number on this page for anyone who has been reading the growth rate above and assuming it continues.
Choosing a measure
No single ratio answers every question about a sector. Each of these pages covers the same eleven sectors — what changes is the question the measure is good at, and how far the coverage reaches.
| Measure | The question it answers | Why that one |
|---|---|---|
| EV/EBITDA | How does one sector compare across markets? | Sits above tax and debt, so it survives crossing borders. The only measure here that makes an international sector comparison sound. |
| P/E and earnings | How fast are a sector’s earnings growing? | Trailing and forward multiples with the earnings behind them, so the multiple and its denominator can be read together. |
| CAPE | Is a sector expensive against its own history? | Averages a decade of real earnings, which smooths the cycle out of the denominator. |
| Price to book | What is the market paying for the assets? | Works where earnings-based measures break down — asset-heavy sectors, and banks in particular. U.S. sectors only. |
| Dividend yield | Which sectors pay, and how much? | Income rather than valuation, but it moves inversely with price and is read alongside the multiples. U.S. sectors only. |
Consumer Discretionary · Consumer Staples · Energy · Financials · Health Care · Industrials · Technology · Materials · Real Estate · Utilities
All eleven side by side: sector valuations. To compare them on one measure: P/E and earnings · CAPE ratios · EV/EBITDA · Dividend yields · Price to book.
Where this data is used
Some examples. Siblis valuation data appears in peer-reviewed journals, central bank publications and the financial press.
The whole communication services history, every trading day
This page publishes ten year-ends and the current reading. The database carries every month back to 1979, for all eleven sectors and every market.
How this is calculated
Every ratio is calculated on the aggregate: the total market capitalisation of the sector's constituents divided by their aggregate earnings, book value or EBITDA, rather than as an average of the constituents' own ratios.
- Trailing P/E — Aggregate normalised net income over the previous twelve months. Major purely accounting gains and losses are removed.
- Forward P/E — Consensus estimates for the next twelve months, aggregated the same way. Estimates are compiled on their own basis, so the step between the trailing and forward multiple indicates the direction and rough size of what is expected rather than a precise growth rate.
- CAPE — Price divided by the average of ten years of inflation-adjusted aggregate earnings.
- EV/EBITDA — Enterprise value over EBITDA, a monthly snapshot rather than a daily calculation.
- Sector definition — Calculated on the current definition across the whole history, including the years before the 2018 reclassification. The series is therefore consistent, but the companies it describes changed.
- Coverage — U.S. series from 1979; global and global ex-U.S. from 1997. Dividend yield and price to book are U.S. only, from 2005 and 1979. The universes are comparable as levels but not as history, because they do not span the same period.
- Earnings growth — Calculated on aggregate sector earnings, not a per-share figure, so it is unaffected by buybacks. The one-year figure compares two month-ends. Rates over five years and longer compare the average of the twelve months at each end, so that one unusual month at the start does not set the whole rate.
- Percentiles — The share of month-ends in that series' own history with a lower reading than the current one.
- Revisions — Figures are point-in-time. If a company later restates its results, the historic reading is left exactly as first published.
Cite this page
Siblis Research. (2026). Communication Services Sector P/E & CAPE [Data set]. Retrieved 30 September 2026, from siblisresearch.com/data/communication-services-sector-valuation/
@misc{siblis_communication_services_sector_valuation,
  title={Communication Services Sector P/E & CAPE}, author={{Siblis Research}},
  year={2026}, url={https://siblisresearch.com/data/communication-services-sector-valuation/},
  urldate={2026-09-30}}
Charts on this page may be reproduced free of charge with attribution to Siblis Research and a link to this page.