
Real Estate sector valuation
American real estate trades at 39.82 times trailing earnings against 14.17 for the rest of the world — a premium of +181%, the largest in the database and not close to second.
It is also the only sector of the eleven whose CAPE sits below its trailing P/E. Four separate things about this sector make it the one most likely to be read wrongly, and they are all in the numbers above.
United States The four headline readings below are for the U.S. real estate sector. The same six measures for the global and global ex-U.S. real estate sectors are in the table that follows.
| Measure | United States | Global | Global ex-U.S. | U.S. premium |
|---|---|---|---|---|
| Trailing P/E | 39.82 | 23.10 | 14.17 | +181% |
| Forward P/E | 33.34 | 23.80 | 16.65 | +100% |
| CAPE | 32.57 | 21.07 | 13.77 | +137% |
| EV/EBITDA | 21.16 | 20.13 | 18.75 | +13% |
| Price to book | 3.07 | — | — | — |
| Dividend yield | 3.69% | — | — | — |
Global covers developed markets, emerging markets and the United States. Global ex-U.S. is the same universe with the United States removed, and still includes both developed and emerging markets. Dividend yield and price to book are published for the U.S. sectors only. Free to reuse with attribution.

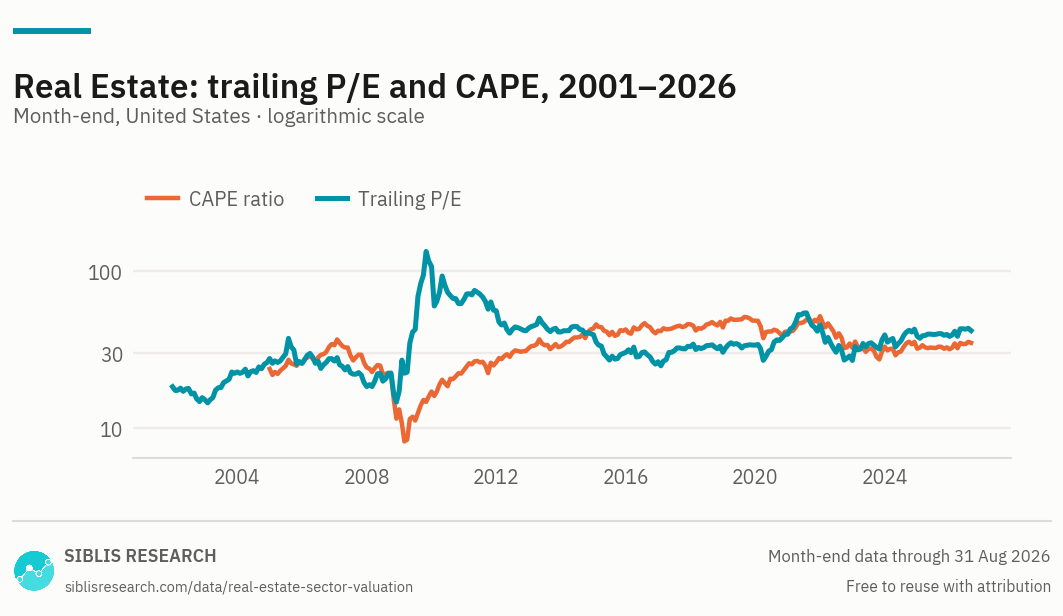
Trailing P/E and CAPE, U.S., from 2001. Unlike every other sector, the CAPE line sits below the P/E line: current earnings are 0.82 times their own inflation-adjusted decade average, which is to say below it.

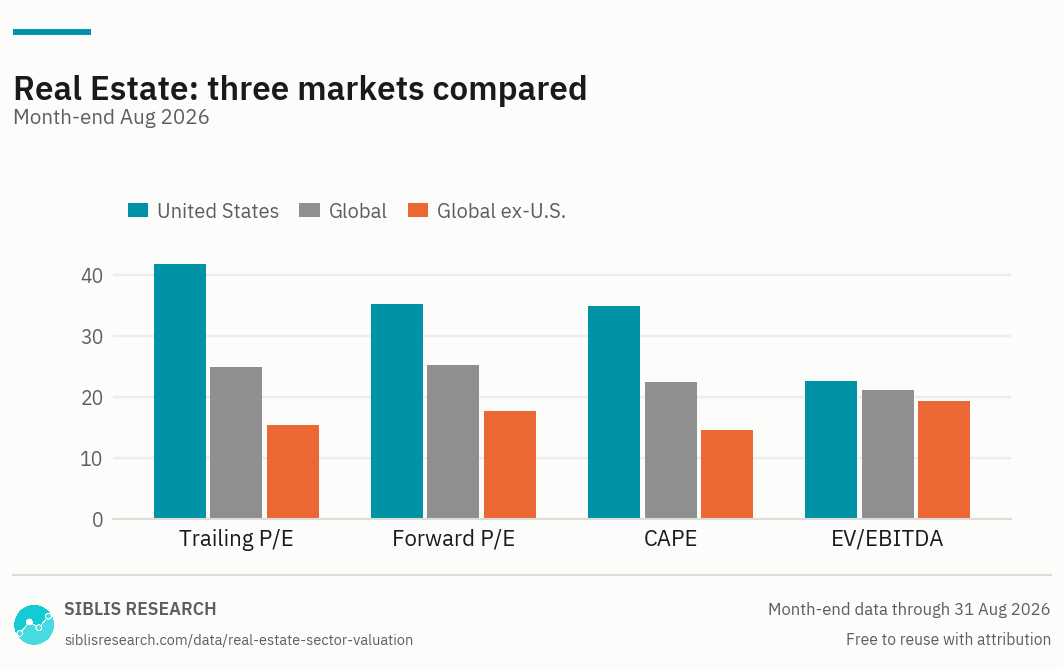
The same four measures, side by side in each market published. The earnings-based premium and the EV/EBITDA premium are not remotely the same number.
| Year | Trailing P/E | CAPE |
|---|---|---|
| 2025 | 38.41 | 31.80 |
| 2024 | 38.48 | 32.10 |
| 2023 | 39.25 | 33.06 |
| 2022 | 26.99 | 32.52 |
| 2021 | 45.48 | 51.66 |
| 2020 | 39.63 | 41.24 |
| 2019 | 33.80 | 48.29 |
| 2018 | 30.44 | 43.75 |
| 2017 | 33.09 | 45.81 |
| 2016 | 26.49 | 41.74 |
The full monthly history from 2001, the dividend yield and price-to-book series, and the global and global ex-U.S. figures are available to subscribers.
United States, Sept 2026
U.S. sector against its own history
A premium of this size is not a valuation statement
U.S. real estate trades +181% above the rest of the world on trailing earnings and +137% above on CAPE. On EV/EBITDA the premium is +13%.
No plausible difference in the price of the same asset produces the first two figures. What produces them is that "real estate" does not describe the same businesses in different markets. In the United States the sector is dominated by real estate investment trusts, which are required to distribute the great majority of their taxable income and whose reported earnings are reduced by heavy depreciation charges on buildings that are not, in fact, wearing out at that rate. Elsewhere the sector holds a larger share of developers and operating companies, whose earnings are recorded on an entirely different basis.
Dividing two different accounting conventions by each other gives a number, and the number is +181%. It is not a mispricing to be arbitraged; it is a statement that the comparison is not measuring what it appears to.
The EV/EBITDA premium of +13% is the more useful of the three, because EBITDA is struck before depreciation and therefore before the largest source of the distortion. That it is so much narrower than the other two is the strongest evidence for the explanation above.
The depreciation problem, stated plainly
Under standard accounting, a building is depreciated over decades, and that charge is subtracted from earnings whether or not the building has lost any value. Property companies therefore report lower net income than their cash generation implies, and any measure built on net income — the trailing P/E, the forward P/E, CAPE — is correspondingly overstated.
This is why the sector reports a trailing P/E of 39.82 while paying a dividend yield of 3.69%, a combination that would be arithmetically impossible if reported earnings were the whole of what these companies generate.
We publish the earnings multiples because they are calculated on the same method as the other ten sectors and because readers ask for them. They should not be compared with another sector's P/E without this in mind. The dividend yield, price to book and EV/EBITDA are the measures that survive the accounting intact.
The only sector earning less than its own decade
The ratio of CAPE to the trailing P/E is 0.82, the lowest of the eleven and the only one below one. In every other sector current earnings exceed their own inflation-adjusted ten-year average; here they sit below it.
The earnings record says the same thing directly. Aggregate earnings grew 0.2% a year over ten years and 3.9% a year over five. Since 2001, in the 272 months where a year-on-year comparison is possible, earnings were below their year-earlier level 42% of the time.
That makes CAPE the flattering measure here rather than the demanding one, which is the reverse of its usual role and worth stating explicitly. A reader who has learned to treat CAPE as the conservative number should not carry that habit onto this page.
The history is short, and short by construction
The U.S. series begins in 2001 and the CAPE series in 2004; the global series begin later still. Every other sector on the site carries a record reaching back to the late 1970s.
The reason is that real estate was not a sector in its own right for most of that period — it was part of financials, and was separated out only when the classification changed. Our financials series is calculated on financials companies only across its whole history, with real estate excluded throughout, so the two do not overlap and adding them together does not reproduce the old combined sector.
The practical consequence is that percentiles on this page are calculated over a much shorter record than elsewhere, and a shorter record contains fewer regimes. The dividend yield of 3.69% sits at the 88th percentile of its history since 2005, and that percentile is a weaker statistic here than the same figure would be for a sector measured since the 1970s. It is stated as a percentile rather than as a position in a range for the usual reason — the range's extremes were set by a crisis — but the caution about length stands on top of that.
Choosing a measure
No single ratio answers every question about a sector. Each of these pages covers the same eleven sectors — what changes is the question the measure is good at, and how far the coverage reaches.
| Measure | The question it answers | Why that one |
|---|---|---|
| EV/EBITDA | How does one sector compare across markets? | Sits above tax and debt, so it survives crossing borders. The only measure here that makes an international sector comparison sound. |
| P/E and earnings | How fast are a sector’s earnings growing? | Trailing and forward multiples with the earnings behind them, so the multiple and its denominator can be read together. |
| CAPE | Is a sector expensive against its own history? | Averages a decade of real earnings, which smooths the cycle out of the denominator. |
| Price to book | What is the market paying for the assets? | Works where earnings-based measures break down — asset-heavy sectors, and banks in particular. U.S. sectors only. |
| Dividend yield | Which sectors pay, and how much? | Income rather than valuation, but it moves inversely with price and is read alongside the multiples. U.S. sectors only. |
Communication Services · Consumer Discretionary · Consumer Staples · Energy · Financials · Health Care · Industrials · Technology · Materials · Utilities
All eleven side by side: sector valuations. To compare them on one measure: P/E and earnings · CAPE ratios · EV/EBITDA · Dividend yields · Price to book.
Where this data is used
Some examples. Siblis valuation data appears in peer-reviewed journals, central bank publications and the financial press.
The whole real estate history, every trading day
This page publishes ten year-ends and the current reading. The database carries every month back to 2001, for all eleven sectors and every market.
How this is calculated
Every ratio is calculated on the aggregate: the total market capitalisation of the sector's constituents divided by their aggregate earnings, book value or EBITDA, rather than as an average of the constituents' own ratios.
- Trailing P/E — Aggregate normalised net income over the previous twelve months. Major purely accounting gains and losses are removed. Depreciation is not removed, which is the main reason this sector's earnings multiples sit above those of the other ten.
- Forward P/E — Consensus estimates for the next twelve months, aggregated the same way.
- CAPE — Price divided by the average of ten years of inflation-adjusted aggregate earnings.
- EV/EBITDA — Enterprise value over EBITDA, struck before depreciation, which makes it the most comparable of the earnings-based measures across markets here.
- Sector history — Real estate is carried as a sector in its own right from 2001. It is excluded from the financials series across that series' whole history, so the two are disjoint rather than continuous.
- Coverage — U.S. series from 2001; global and global ex-U.S. from 2006. Dividend yield and price to book are U.S. only, from 2005 and 2001. The universes are comparable as levels but not as history, because they do not span the same period.
- Earnings growth — Calculated on aggregate sector earnings, not a per-share figure, so it is unaffected by buybacks. The one-year figure compares two month-ends. Rates over five years and longer compare the average of the twelve months at each end, so that one unusual month at the start does not set the whole rate.
- Percentiles — The share of month-ends in that series' own history with a lower reading than the current one.
- Revisions — Figures are point-in-time. If a company later restates its results, the historic reading is left exactly as first published.
Cite this page
Siblis Research. (2026). Real Estate Sector P/E & Dividend Yield [Data set]. Retrieved 30 September 2026, from siblisresearch.com/data/real-estate-sector-valuation/
@misc{siblis_real_estate_sector_valuation,
  title={Real Estate Sector P/E & Dividend Yield}, author={{Siblis Research}},
  year={2026}, url={https://siblisresearch.com/data/real-estate-sector-valuation/},
  urldate={2026-09-30}}
Charts on this page may be reproduced free of charge with attribution to Siblis Research and a link to this page.