
Capital Markets valuation multiples
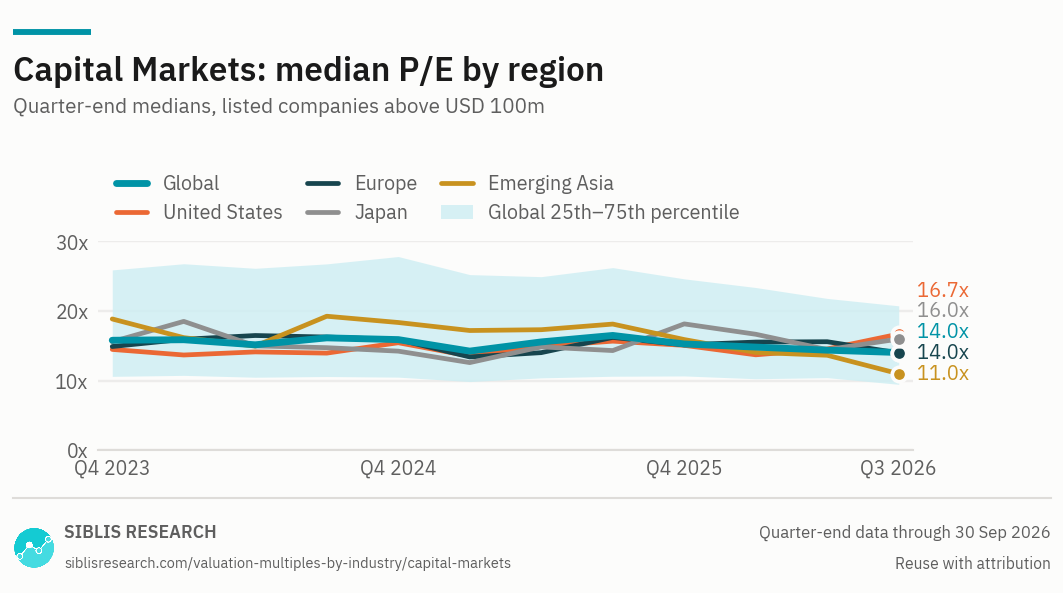
Worldwide, the median listed capital markets company was valued at 14.0x normalised earnings and 1.5x book value at 30 September 2026. By region, the median was 16.7x in the United States, 14.0x in Europe, 16.0x in Japan and 11.0x in Emerging Asia.
Global 443 listed capital markets companies at 30 September 2026
median
median
median
median
*Excludes companies with negative normalised earnings. **Excludes companies with negative book equity. ***Excludes companies with negative tangible book equity. How the figures are built
| P/E | P/B | ||||
|---|---|---|---|---|---|
| Region | Companies | Median | Aggregate | Median | Aggregate |
| Global | 368 | 14.0x | 16.6x | 1.5x | 2.5x |
| United States | 101 | 16.7x | 18.0x | 2.3x | 3.1x |
| Europe | 74 | 14.0x | 18.4x | 2.0x | 2.6x |
| Japan | 28 | 16.0x | 11.3x | 1.5x | 1.8x |
| Emerging Asia | 123 | 11.0x | 10.7x | 1.0x | 1.1x |
Companies: those in the P/E median. Median: the typical capital markets company. Aggregate: the industry as a whole, total value over total revenue, earnings or book value, with larger companies weighing more and loss-makers included. In Europe the larger companies trade on higher multiples than the typical one, so the aggregate sits above the median. In Japan it is the other way round, and the aggregate sits below the median. n/m: not meaningful, or too few companies. How both are calculated
Valuation multiples by sector and region
What listed companies trade on worldwide, by region and sector, in ten pages. It may be shared and quoted with attribution to Siblis Research.
- Market multiples for eight regions: EV/EBITDA, P/E, EV/Sales, P/B
- 13 sectors by region: EV/EBITDA and P/E
- The most and least expensive industries
- Twelve quarters of history

| Multiple | Global | United States | Europe | Japan | Emerging Asia |
|---|---|---|---|---|---|
| P/ENormalised earnings: one-off items removed. The key multiple for capital markets companies. | 14.0x | 16.7x | 14.0x | 16.0x | 11.0x |
| P/BMarket value to book equity. | 1.5x | 2.3x | 2.0x | 1.5x | 1.0x |
| P/TBVMarket value to tangible book equity. | 1.3x | 5.5x | 4.3x | 1.6x | 1.0x |
| Ratio | Global | United States | Europe | Japan | Emerging Asia |
|---|---|---|---|---|---|
| Return on equity | 11.8% | 12.0% | 14.8% | 14.7% | 9.3% |
| Return on tangible equity | 13.1% | 11.6% | 21.5% | 15.5% | 9.7% |
| Return on assets | 2.5% | 2.6% | 3.6% | 4.9% | 1.7% |
| Net margin | 25.2% | 14.6% | 19.6% | 25.1% | 34.7% |
Each ratio is the median of the companies that report the figure. Revenue growth compares the last twelve months with the twelve months before.
Global
- Morgan StanleyUS
- Goldman Sachs Group IncUS
- BlackRock IncUS
- Charles Schwab CorpUS
- Blackstone IncUS
of 443 companies
United States
- Morgan StanleyUS
- Goldman Sachs Group IncUS
- BlackRock IncUS
- Charles Schwab CorpUS
- Blackstone IncUS
of 121 companies
Europe
- Deutsche Börse AGGermany
- London Stock Exchange Group plcUK
- EQT ABSweden
- Amundi SAFrance
- Euronext NVFrance
of 105 companies
Japan
- Nomura Holdings IncJapan
- Daiwa Securities Group IncJapan
- Japan Exchange Group IncJapan
- SBI Holdings IncJapan
- Matsui Securities Co LtdJapan
of 28 companies
Emerging Asia
- CITIC Securities Co LtdChina
- Guotai Junan Securities Co LtdChina
- East Money Information Co LtdChina
- Yuanta Financial Holdings Co LtdTaiwan
- Huatai Securities Co LtdChina
of 135 companies
Subscribers get the figures of all 443 companies at 30 Sep 2026, and of every company in earlier quarters, delisted ones included, with their key multiples, size band, last reporting date and data flags. Every median and aggregate can be checked company by company, and every company figure traced back to that company's own filings.
| Sub-industry | Covers | P/E | P/B |
|---|---|---|---|
| Asset Management & Custody | Asset managers, alternative managers, custody banks | See plans | See plans |
| Investment Banking & Brokerage | Investment banks, brokers, market makers | See plans | See plans |
| Exchanges & Financial Data | Exchanges, clearing houses, ratings, index and financial data | See plans | See plans |
| Business Development Companies | BDCs and other closed-end investment companies (SIC investment company) | See plans | See plans |
Global medians, 30 Sep 2026
Global median P/E, 12 quarters
Capital Markets in the full data
The United States up, Emerging Asia down
The median US capital markets company trades at 16.7x normalised earnings, up from 14.5x in Q4 2023 and the highest of the four regions. Emerging Asia's median has gone the other way, from 18.9x to 11.0x, its lowest in the period. Europe trades at 14.0x and Japan at 16.0x; the global median is 14.0x.

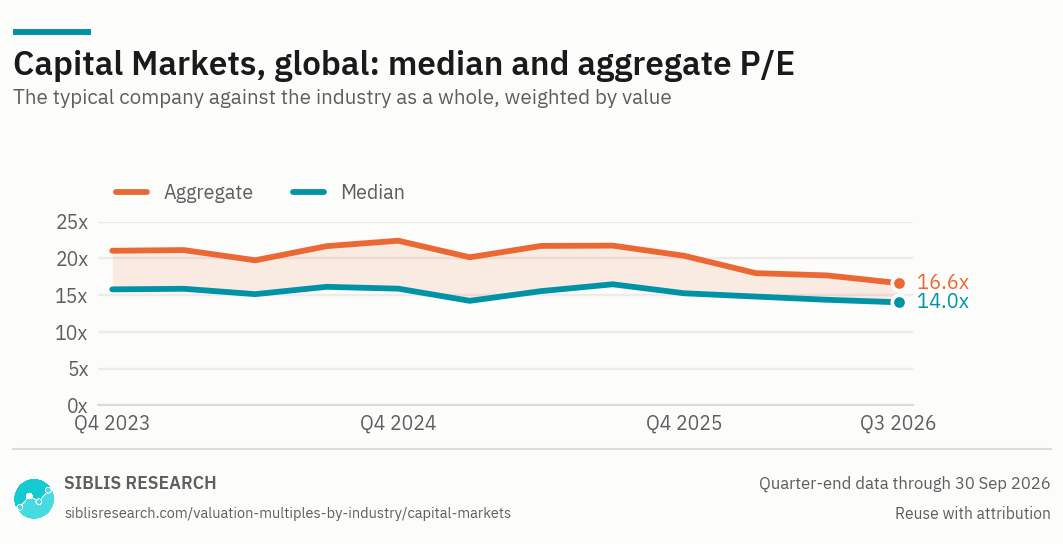
The global aggregate has fallen from 21.1x to 16.6x, and the gap between the largest companies and the typical one has narrowed.
Size
In the United States large caps (above USD 10bn) trade at a median 20.3x normalised earnings, against 12.3x for small caps. The largest companies include exchanges, data providers and asset managers with recurring fees; many smaller ones are brokers and dealers whose earnings follow market activity.
Book value
US companies trade at a median 2.3x book value on a median return on equity of 12.0%; Emerging Asian ones at 1.0x on 9.3%. For an asset manager or an exchange, book value says little, and the P/E is the better guide; for a broker or an investment bank, P/B is the usual cross-check.
What P/E multiple do capital markets companies trade at?
The median listed capital markets company traded at 14.0x normalised earnings (P/E) at 30 September 2026, across 368 companies above USD 100m; the aggregate was 16.6x. United States 16.7x, Europe 14.0x, Japan 16.0x, Emerging Asia 11.0x.
What is the median P/B of capital markets companies?
1.5x at 30 September 2026, across 411 companies; the aggregate was 2.5x.
Should a valuation use the median or the aggregate?
The median, with the 25th and 75th percentiles of a peer group close to the target in sub-industry and size. The aggregate describes the industry as an investor holding all of it would see it, and it is pulled towards the largest companies.
Do these figures include private capital markets companies?
No. They cover listed companies with a market value above USD 100m. Data for US companies of USD 25–100m is available to subscribers as a separate universe.
Global Equity Valuations Database
- Question
- Is this market cheap or dear against its own history?
- Covers
- Stock market indices and their sectors, back to 1970 on the longest series
- Delivered
- Daily, through an API, with a monthly Excel dashboard
Siblis Global Valuation Multiples
- Question
- What does a company like my target trade on, and who are its listed peers?
- Covers
- 70 industries, 139 sub-industries and about 25,000 companies, delisted ones included
- Delivered
- Excel reports for every quarter end, licensed for client work
Every industry, at any valuation date
One subscription covers all 70 industries and 139 sub-industries in eight regions: about 25,000 companies, delisted ones included, at every quarter end since Q1 2009.
Siblis Research in research and the press
Siblis Research market valuation data appears in peer-reviewed journals, central bank publications and the financial press.
Companies with a market value above USD 100m whose main business is investment banks, brokers, asset managers, exchanges and financial data providers, listed on the largest stock markets in every region. Delisted companies are included for the dates they were listed, so past figures carry no survivorship bias.
Financial statements come from official filing databases where they exist, such as SEC EDGAR in the United States and EDINET in Japan, and otherwise from the companies' own published reports.
443 capital markets companies at 30 September 2026. The number changes every quarter as companies list, delist or change industry. Companies with accounts more than about nine months old, and holding companies whose results are mainly revaluations of their investments, are left out.
The typical company: each counts once, from at least five values. A company with negative EBITDA, operating profit or normalised earnings is left out of the median of that multiple, as are multiples above 50x for EV/Sales or 100x for earnings multiples. So each median has its own number of companies.
The industry as a whole: total value over total revenue or earnings in US dollars, each company weighted by its free float, loss-makers included. Where one company is more than half the industry's value, the aggregate mostly describes that company; use the median.
Each figure uses only the financial statements public on the valuation date, over the last twelve months. Later restatements never change it.
Market value plus debt, preferred equity and minority interests, less cash. Lease liabilities are included on the IFRS 16 basis.
Restructuring, deal and litigation costs are added back; share-based pay stays an expense. Adjusted EBITDA adds share-based pay back as well.
Net earnings with one-off items removed, such as impairments, restructuring costs and disposal gains. The P/E uses these, never reported earnings.
Cite this page
Siblis Research (2026). Capital Markets Valuation Multiples [Data set]. Valuation date 30 September 2026. siblisresearch.com/valuation-multiples-by-industry/capital-markets/
Charts on this page may be reproduced with attribution to Siblis Research and a link to this page.
@misc{siblis_capital_markets_multiples,
  title  = {Capital Markets Valuation Multiples},
  author = {{Siblis Research}},
  year   = {2026},
  note   = {Valuation date 30 September 2026},
  url    = {https://siblisresearch.com/valuation-multiples-by-industry/capital-markets/}
}